The search for a better yardstick.
Hossein Haeri and Sami Khawaja are executive director and senior vice president at The Cadmus Group.
These are hard times for those trying to design, much less implement, energy efficiency programs. New energy building codes and equipment standards have shrunk the technical potential for conservation. Markets for program staples such as compact fluorescent lamps and low-cost weatherization are being saturated, paradoxically, by the accomplishments of ratepayer-funded programs, especially in states that have been in the vanguard of energy efficiency – a peril of success.

Meanwhile, avoided energy costs, the benchmark for valuation of energy efficiency, are declining. Blame that largely on unforeseen natural gas prices – as low as $2 per million Btu – caused by a drop in aggregate demand, along with recent discoveries of conventional natural gas reserves and new extraction techniques that have opened vast supplies of unconventional gas. This lowered benchmark has raised the cost-effectiveness threshold for energy efficiency measures, causing many marginal measures to fail economic tests, thus lowering the overall economic potential of energy efficiency.
These twin forces (transforming markets and low avoided costs) leave program administrators hamstrung to meet their saving targets. That likely will undermine energy efficiency portfolio standards in many jurisdictions. As a result, a new debate has been touched off about reforming – or replacing – the total resource cost (TRC) test, the main standard for economic valuation of ratepayer-funded energy efficiency in most jurisdictions.
These events haven’t displaced the basic questions governing energy efficiency policy and program design: how much efficiency is technically feasible, how much is economical and what roles the consumers and the utility should play in achieving it.
The supply of energy efficiency (its potential) is largely a technical question. It’s determined by physical factors such as features of energy-efficient technologies, saturation of fuels and end-uses, and prevailing energy codes and standards. (Behavioral factors that affect how consumers decide to invest in efficiency are complex, so the question of market potential hasn’t yet been settled.)
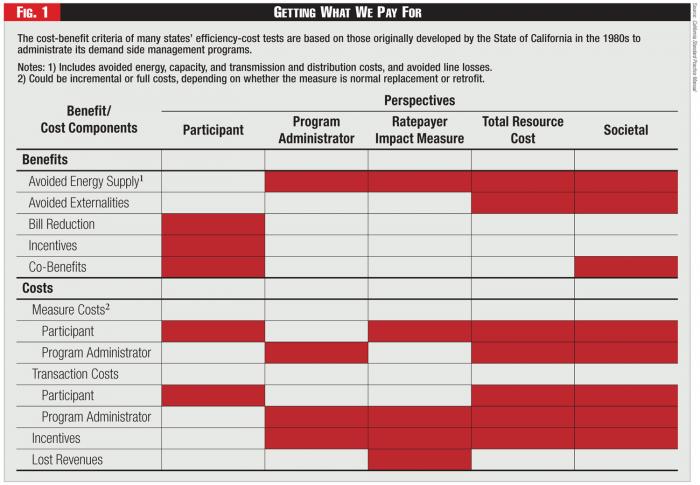 Figure 1 - Getting What We Pay For
From an economic perspective, energy efficiency policy decisions are fundamentally about the level of ratepayer funds that should be invested in energy efficiency – in other words, what a “negawatt” is worth. This is generally decided systematically through a formal integrated resource planning (IRP) process or through mandated energy efficiency resource standards (EERS).1 In either case, the question is a matter of perspective: what the relevant benefits and costs are, and what discount rate will best align the stream of future benefits with current expenditures.
These questions have been the subject of a three-decades-long debate among energy policy analysts, who have landed in two camps. In one are those who argue that the criteria that regulators use to determine cost effectiveness tend to overvalue energy efficiency and lead to over-investing. In the other are those who believe the decision rules lead to undervaluation and sub-optimal investment levels.
At the center of this debate is the question of what yardstick to use to value a unit of saved energy. Should regulators retain the total resource cost test, or to switch to another method – one better adapted to the current climate?
The California Model
Most regulatory jurisdictions in the United States have adopted – or recognize – a series of tests originally developed in California in the early 1980s for empirically analyzing the economic benefits of energy efficiency. These tests and the underlying calculations are described in the California Standard Practice Manual: Economic Analysis of Demand-Side Management Programs and Projects (California Standard Practice Manual or SPM).2
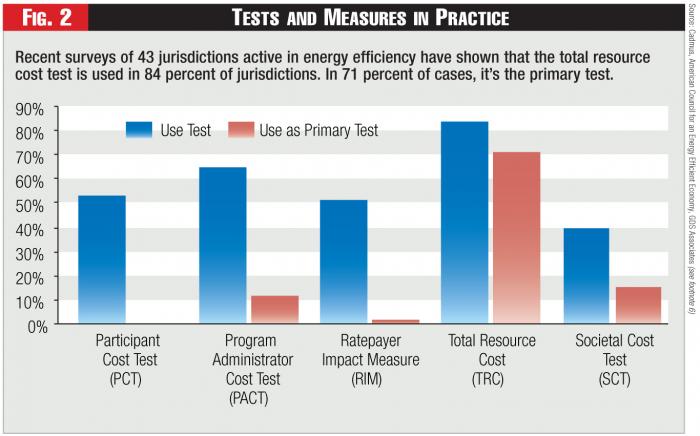 Figure 2 - Tests and Measures in Practice
California’s SPM model defines five benefit-cost tests: 1) the participant test, 2) the program administrator – or “utility” – cost (PAC) test, 3) the ratepayer impact measure (RIM) test, 4) the total resource cost (TRC) test, and 5) the societal cost test (SCT). Each test in turn is designed to represent the benefits and costs of ratepayer-funded energy efficiency from a particular perspective: 1) the program participant, 2) the program administrator, 3) nonparticipants, 4) the utility system, and 5) society as a whole. The main difference among these tests is how the various benefits and costs of energy efficiency are allocated among the interested parties or “stakeholders” (see Figure 1).
The results of these tests generally are expressed as either the ratio of the discounted life-cycle benefits and costs of energy efficiency (benefit-to-cost ratio), or the difference between the two (net present value of benefits).
The TRC test measures the cost-effectiveness of energy efficiency from the broader, system-wide perspective. The test incorporates the full or incremental cost of the energy efficiency measure, depending on whether the energy-efficient measure replaces a functioning equipment unit (retrofit) or one that has reached the end of its useful life (replacement on burnout), and transaction costs accruing to the participant and the program administrator. The PAC test is a variant of the TRC test that includes only the utility’s share of the costs.
The SCT offers the broadest perspective, with the most comprehensive benefits. It’s a more expansive form of TRC and encompasses society-wide impacts. Examples are avoided environmental externalities that aren’t internalized in calculation of energy supply costs, saving of non-energy resources such as water, and non-energy co-benefits to participants such as comfort and health and, in the case of low-income customers, enhanced ability to pay bills. The benefits in the SCT are generally valued at a lower, “societal” discount rate (often pegged to the Treasury Bills rate).
By contrast, the RIM test measures cost-effectiveness from the utility ratepayer perspective and the effects of energy efficiency on rates. The benefits included in the RIM test are avoided energy and capacity costs, and avoided operating losses – all of which tend to lower the utility’s revenue requirement. The costs include program administration, incentive payments, and importantly, the lost revenue resulting from the foregone sales.
Several other tests, such as the public purpose test and the total market effects test have also been proposed.3 The most expansive of these tests are the “most value”4 and “value”5 tests, which attempted to incorporate other factors associated with energy efficiency, such as freeridership, rebound, quality of energy service, and the effects of changes in rate and cost on consumer demand for electricity. However, none of these tests have drawn much interest. The five tests defined in the SPM remain the most common measures for determining cost-effectiveness in energy efficiency planning and policy making.
The SPM today continues to serve as the standard guideline for analyzing the cost-effectiveness of ratepayer-funded energy efficiency in most regulatory jurisdictions in the U.S. But the five tests are being used differently and at different rates, according to the guidelines established through local regulatory – and in some cases legislative – mandates.
TRC is by far the most commonly used test among jurisdictions active in energy efficiency. Recent surveys of 43 jurisdictions active in energy efficiency have shown that TRC is used in 84 percent of jurisdictions; in 71 percent of cases, it’s the primary test (see Figure 2).6 The PAC is the second most widely used test (65 percent of states) and is the primary metric for screening energy efficiency programs in 12 percent of the surveyed jurisdictions. The SCT is used in 40 percent of states and in six (15 percent) it’s the primary criterion. More than half of the surveyed jurisdictions use the RIM test, but it’s the primary test in only one case: Virginia. Although most jurisdictions evaluate energy efficiency programs from the PCT perspective, no jurisdiction uses the test as the primary screening criterion.
Even in states where TRC is the main criterion, regulators can apply that test with different degrees of stringency. In most cases, it’s applied at the portfolio level, across all programs, so individual programs can be accepted even if non-cost-effective (e.g., Iowa). In other cases, regulators require that every program passes TRC (e.g., Idaho). In some states, such as New York, the criterion is applied even more strictly, requiring every measure offered by the program administrator to be cost effective.
A Gathering Crisis
The total resource cost test has a history of controversy, centered principally on the way it accounts for the relevant benefits and costs. The early criticisms of TRC focused on the test’s failure to factor in the impacts of energy efficiency measures on a utility’s revenue and rates. By ignoring the rate impacts – and the resulting higher bills for nonparticipants – the critics reasoned, the test understated the actual cost of conservation and led to over-investing.7
These critics proposed instead to use the RIM test, which caps expenditures on energy efficiency at an amount equal to the difference between the utility’s rate and the marginal cost, and avoids having one group of customers subsidize the lower bills of another.8 This idea drew attention to the distributional effects of ratepayer-funded energy efficiency. It led to the coining of the phrase “no-loser” test, meaning the costs of conservation are borne by those who benefit from it, in reference to the RIM. But the TRC issues also became a proxy for bigger arguments, including a mutually reinforcing skepticism about the fundamental notion of least-cost planning and the role of utilities in energy efficiency markets.9
On the opposing side are those who believe that TRC ignores important benefits, and thus leads to under-investing in efficiency. This argument has gained new currency among the advocates of ratepayer-funded programs, who object to TRC’s incomplete accounting of energy efficiency’s benefits – mainly avoided environmental externalities, other types of fuel savings beyond what the program targets, and lowering the demand for other resources, such as water. Some policy analysts purport to link energy efficiency with all manner of other goods – the so-called co-benefits – such as greater comfort, better aesthetics, enhanced productivity, improved health, and others.10
The Rescue Plan
The mainstream consensus has long been that the TRC offers a reasonably sound way of deciding how much to invest in efficiency. Now, however, the threat of a shrinking market for ratepayer-funded energy efficiency has spawned a wave of ideas to reform the test in ways that make it easier for energy efficiency measures to pass it. The proposed solutions range in scope and implication from small refinements to more radical solutions such as abandoning the test altogether.11
The arguments for a modified TRC come in many guises, but they share the objective of lowering the threshold for determining cost effectiveness, which might be achieved in one or more of three ways: including additional benefits, eliminating certain costs, or using a lower discount rate for aligning the streams of benefits and costs.
The most obvious solution is the oldest and the one most commonly proposed: use a broader set of benefits that provides the best measure of public-policy benefits that are important to policy makers. These benefits could be accounted for to the extent that is practical and applicable in the context of SCT.12
But these indirect benefits are notoriously difficult – and expensive – to quantify. That’s why, in several states where they are recognized, they are represented in the form of a simple multiplier or “adder.” The problem with measuring these benefits also has sparked proposals for factoring them into the benefit-to-cost calculations indirectly.
Two approaches have been proposed.
The first involves using a discount rate lower than the conventional program administrator’s weighted cost of capital. By deflating these benefits at a lower rate, this approach serves as an expedient means of improving the benefit-to-cost ratio without going through the trouble of quantifying and adding in the indirect, hard-to-measure benefits. Another argument for using a lower discount rate has been made on the basis of the presumably lower risks to the utility in investing in energy efficiency than in generating.13
Yet there’s no economically justifiable rationale for settling on a lower discount rate and, even if one existed, using such a discount rate would be inconsistent with the idea of treatment of supply- and demand-side resource options equally: the basic principle of integrated resource planning.
The second approach simply ignores the participants’ contributions in measuring cost. Since most of the non-energy benefits and co-benefits of energy efficiency accrue only to participants, the argument goes, why not assume that these benefits offset at least some of the costs to the participant. This line of reasoning in effect leads to using the PAC test instead of TRC.
TRC and the Tyranny of Costs
The TRC test is first and foremost a measure of economic efficiency. As stated in the SPM, the test measures the net costs of energy efficiency as a resource option, based on its total cost, including both the participants’ and the utility’s costs.14 The presumed strength of the test – possibly the main reason for its preeminence – is its scope: the TRC test accounts for all of the cost and benefits in the context of resource planning.
The TRC test combines the costs and benefits from the participants’ (PCT) and nonparticipants (RIM) perspectives, where the revenue change (to the utility) and the bill savings (to the participants) cancel out. Arithmetically, the benefit and cost terms in the TRC test are the sum of costs and benefits to participants and all ratepayers (hence the former name for the TRC test, the “all ratepayers test”). But it would be misleading to suggest that the test is representative of the combined perspectives of participants and nonparticipants. It represents neither, because bill reductions (the main benefit to participants) and the utility’s lost revenue (the main cost to nonparticipants) are ignored.
The test, as formulated in the SPM, has other aspects that weaken it in both concept and practice. Primarily, these shortcomings relate to the distinct but related issues of determining the incremental costs of an efficiency measure and the setting of incentives, both of which continue to befuddle analysts, even after 30 years of widespread use.
As the SPM prescribes it, the TRC relies on either full or incremental cost of the energy efficiency measure, depending on whether the measure constitutes a retrofit or a replacement on burnout. While calculating a retrofit project’s total costs might be relatively straightforward, estimating incremental costs, that is, the cost of the measure relative to a baseline technology, can be complicated, especially where non-standard, custom measures are involved.
The reliance on incremental cost also has led to the pervasive practice by program administrators to view incentives as a means of defraying part of the participant’s cost, rather than reflecting the value of the energy saved. In many cases, such as new construction or comprehensive lighting retrofits, it’s difficult to establish a base line technology, let alone an incremental cost.
With the rare exception of performance contracting schemes, incentives today are largely set to offset portions of incremental costs, in many cases as arbitrary fixed amounts, presumably according to program administrators’ expectations about consumers’ willingness to adopt uncommon energy-efficient measures. This is why it’s not uncommon today to see neighboring utilities offer different incentives for the same measure, regardless of whether and to what extent their avoided costs might vary.
This cost-based method, whereby incentives are tied to the cost of the measure, rather than the value of the saving it produces, is also inconsistent with the basic principle of integrated resource planning. After all, the choice of energy supply options, such as alternative resources for power generation, isn’t made based on their incremental costs, but on the value of their output. The incentives paid by utilities should be determined according to the avoided cost benefits they offer, and not their cost relative to a theoretical baseline. This also nicely chimes with the notion that participant costs should be left out of the TRC calculations, not because they don’t matter, but because they’re unrelated to the utility’s resource procurement process.
Moreover, tying incentives to avoided costs doesn’t necessarily mean higher costs for the utility. Avoided costs should simply establish the ceiling and let program administrators pay as little as possible to acquire the resources they need, as prudence dictates. The principle of least-cost planning should still apply.
The definition and treatment of incentive payments creates yet another source of confusion about the TRC. According to the SPM, incentives should be excluded from the TRC calculations because “they represent transfer payments” from one group of ratepayers (nonparticipants) to another group (participants). A literal reading of this guideline that conceives of incentives purely as a transfer suggests incentives should be excluded from TRC calculations.
Because TRC is based on the incremental measure cost, regardless of how that cost might be shared between participants and the program administrator, and to the extent that incentives cover part of the measure’s cost, they are already factored in the cost side of the equation. Thus, from an accounting point of view, including incentives in the TRC would result in double-counting of the portion of the measure’s cost that incentives are supposed to cover. This interpretation is consistent with the clarification in the SPM that “if the incentive is to offset a specific participant cost …the full customer cost must be included.”15
This footnoted clarification, however, often goes unnoticed (or ignored), leading to TRC analyses that significantly understate costs, particularly in certain popular programs such as appliance recycling, where the program doesn’t require an investment by the participant in the same way that purchasing new energy-efficient equipment would.
The ambiguity in the definition and the method for treatment of incentives has made room for different interpretations and inconsistent methods for economic screening of energy efficiency programs across different jurisdictions, especially when demand-response options are evaluated.16 A cursory survey shows that in some states, such as Iowa, Oregon, and Washington, utilities have explicitly included incentives in TRC calculations of such programs, but in other states, such as Wisconsin, Idaho, Nevada, and others, they haven’t. In states such as Michigan and Utah, where the PAC, rather than the TRC test, is the required criterion, all incentives are by definition included in the analysis.
The conceptual and practical limitations of TRC underscore its inadequacy as a policy guide and, at the same time, highlight the PAC test’s inherent superiority in several respects: it avoids uncertainties regarding the choice of discount rate, defining incentives and deciding how to account for them later. After all, in the context of the PAC test, there’s no question about the appropriateness of using the utility’s cost of capital to discount savings, or how the incentive payments should be treated.
Critically, the PAC test is more consistent with the basic idea of least-cost planning. It puts demand-side measures more squarely on the same footing as supply options. It also ensures consistency in the way energy efficiency resources are screened – during IRP processes and when programs are designed, implemented, and evaluated.17
The PAC test also is straightforward from a resource procurement point of view: it turns energy efficiency into a simple transaction between the utility and consumers, whereby the incentive amount signals the price the utility is willing to pay for a negawatt-hour and the customers accept or reject the price according to their expected return on investment. This is much the way utilities – and regional transmission system organizations (RTO) – evaluate demand response programs. Participant costs need not be a part of the utility’s calculation – the acceptance of the offer should be sufficient as proof that the benefits to the participant must at least offset the costs resulting from the foregone energy service.18
A Focus on Benefits
There’s good reason to be apprehensive about how the current low avoided costs might weaken the momentum in energy efficiency investment and the delivery infrastructure that has taken a good part of two decades to build.
In a recent study of the national trend in energy efficiency investment, researchers at the Lawrence Berkley National Laboratory estimated that by 2025, assuming a case scenario for “medium” expansion, spending on ratepayer-funded electric and gas efficiency (excluding load management) was likely to double from the 2010 level of 2.8 billion to $9.5 billion.19 The main drivers underlying this expansion, the study’s authors reckon, are legislative and regulatory portfolio standards and the DSM activities related to utility integrated resource planning. The study suggests that expenditures might approach a more even geographic distribution over time, with a moderate decline in the Northeastern and Western states and a corresponding increase in the South and the Midwest.
Under this medium-case scenario, incremental annual electric savings are projected to increase from nearly 18.4 terawatts in 2010 (about 0.5 percent of electric utility retail sales) to almost 29 terawatts in 2025 (0.8 percent of retail sales). These savings would likely offset most of the load growth under the Energy Information Administration’s (EIA) most recent reference case forecast of retail electricity sales through 2025.
These numbers illustrate both how far energy efficiency has come, and how far it still can go. But the trajectory for the expansion of ratepayer-funded energy efficiency will depend also on a series of key challenges and uncertainties in the broader market and policy contexts. One of the main uncertainties regarding this pathway, the Lawrence Berkeley study finds, are low avoided costs, precipitated largely by low natural gas prices that translate into reduced program benefits. This climate constrains total efficiency spending and flexibility in program design as benefit-to-cost ratios decline.
Gas efficiency portfolios and more creative and comprehensive multi-measure programs will be especially at risk. On one hand, low prices will give natural gas an advantage over energy efficiency as a measure for reducing emissions, as utilities would switch more generation from coal to gas, instead of investing in energy efficiency. But there’s good reason for believing that this grim outlook might be exaggerated.
As recent history has shown, natural gas prices are nothing if not volatile. They could rise as quickly as they have fallen. Low gas prices are prone to stimulate demand and encourage consumers to convert to gas heating from other fuels. Economic recovery, even at a modest rate, will most likely increase the demand for natural gas, especially in the chemical manufacturing sector, where lower prices offer considerable competitive advantage in the international markets and lead to boosts in production.
Natural gas currently fuels roughly one-quarter of power production capacity in the U.S. That proportion is likely to grow as more gas-fired units are brought online by power producers to switch from higher-priced coal, lowering carbon emissions at the same time. Since much of the gas units are currently being used to satisfy peak demand, there’s significant excess capacity that can be brought online quickly. These realities, and the export of potentially large amounts of liquefied natural gas to high-price areas like Europe, are good reasons for suspecting that the current price forecasts might be too optimistic. Gas prices are difficult to predict, but the betting has to be that they will go up.
Aside from the questions about natural gas and its effect on avoided costs, there is the matter of externalities that today are largely ignored in avoided cost calculations. The issue is especially relevant in the context of a national carbon policy. Current EIA estimates show that, based on the average heat rate of power plants in the country, about one pound of CO2 per kWh is produced from natural gas and twice as high for coal.
According to a recent forecast by Synapse, an energy policy consultancy, carbon costs are estimated to reach $20 per ton in 2020, and as much as $65 per ton in 2040. The forecast represents a scenario in which a federal cap-and-trade program is implemented with significant but reasonably achievable goals, likely in combination with complementary policies to give some flexibility in meeting the reduction goals.20 Based on these figures, incorporating carbon costs can lead to higher power costs of $.02 in 2020 to $.065 in 2040 per kWh for coal-based power, and half as much for natural gas-based power production. Adding these values to current avoided power production costs will dramatically lower the bar and help qualify many more energy efficiency measures.
Evaluating such externalities and properly incorporating them into avoided cost calculations also will help to coordinate supply-side with demand-side policies more closely, especially in states with both renewable portfolio standards (RPS) and energy efficiency portfolio standards (EEPS). In these cases, states could improve resource allocation if these two policies were coordinated by factoring the higher renewable energy procurement cost into determining cost-effectiveness for energy efficiency investments.
Because renewable energy is relatively expensive when compared to conventional fossil-fired energy, using renewables as a benchmark raises the cost-effective level of energy efficiency investments.21 This was the approach recently adopted in British Columbia, where the long-run marginal cost of clean energy was used as a basis for determining cost effectiveness of natural gas and electric energy efficiency. Under this policy, energy efficiency is in effect allowed to compete with (higher-cost) renewables, rather than (lower-cost) conventional generation options.22
Observing Rate Impacts
Nearly lost in the recent debate about TRC have been concerns about the potential distributional impacts of energy efficiency. The RIM test, though largely recognized as a measure of equity in energy efficiency policy, is a blunt instrument. It’s hard to tell the difference between a program performing with a RIM benefit-to-cost ratio of, say, 0.8 and one with 0.6. Since most energy efficiency programs fail the test, it’s unclear what policy guidance the test’s outcomes might offer.
The advocates and critics of ratepayer-funded energy efficiency both tend to view the policy questions narrowly in terms of economic efficiency – or least cost – from a particular point of view. They ignore equity. From a policy point of view, decisions about energy resource options must be made with reference to both efficiency and equity as goals. But none of the five standard tests of the SPM can do both. The equity question is mostly about whether energy efficiency benefits all ratepayers or just the average ratepayer.
Rates are fundamentally a measure of a utility’s average revenue requirement, which can be expressed as the ratio of the utility’s total revenue requirement versus units of energy sold. Implementing energy efficiency programs affects both the numerator and the denominator of this basic relationship. Any energy efficiency program that passes the TRC (and by extension PAC) test would lower the utility’s revenue requirement; thus, total customer bills would go down. However, except in the rare case when rates are lower than marginal costs, rates (average revenue requirement) will have to go up in order for the utility to recover the revenue lost to a reduction in unit sales.
Of course, this wouldn’t be a problem if all customers participated in the program, since all customers would experience a drop in their energy bills: “It would not matter if rates went up; their total cost of energy would still go down.”23
While the effects of energy efficiency on revenue requirements are generally reconciled in rate cases, the lower sales – and the associated lost revenues – continue over the life of the energy efficiency measure. For measures being implemented over multiple years, these effects become more pronounced as their savings accumulate. The magnitude of the net impacts of energy efficiency measures on rates varies, depending on the particular measure’s features such as its expected useful life, savings, and incentives paid by the program administrator.
The rate impacts also vary over time. The greatest impacts tend to show in the short run, as the utility recovers its direct demand-side expenses. Medium-term impacts, largely resulting from lost sales, tend to be more moderate. In the long run, depending on the composition and trend in the utility’s fixed and variable avoided costs, the impacts likely will be small. Energy efficiency programs might also affect customers in particular rate classes differently, depending on whether they participate in a demand-side program. For nonparticipants, bill impacts arise as a direct result of the impacts of demand-side programs on rates. If energy efficiency leads to higher rates, nonparticipants will see a proportional increase in their bills for the same level of consumption.
A more exact – and useful – measure of distributional effects would be to directly assess the annual rate impacts of energy efficiency. Until recently, policy makers have paid little attention to rate impacts. There’s evidence that this neglect might soon end. As investment in energy efficiency grows and its effects on sales become more acute, the rate impacts have become more pronounced. Policy makers and regulators have begun to consider the rate impacts with greater scrutiny. Recently, the Vermont Public Service Board included an evaluation of the expected rate impacts as a decision criterion in evaluating long-run energy efficiency targets.24 And in 2011 the Nevada Public Utility Commission directed NVE to devise and implement a method for measuring the actual rate impacts of NVE’s proposed 2011-2013 energy efficiency plan.25
Of course, measurement alone wouldn’t mitigate the effects of energy efficiency on rates, but achieving an understanding of what’s going on is important. Measurement also doesn’t offer a definitive answer to basic questions such as how much of a rate impact is acceptable. These are questions that must be answered by regulators and policy makers.
Planning Ahead
Switching from TRC to the PAC test isn’t merely a means of relaxing the cost-effectiveness criterion for ratepayer-funded energy efficiency so as to keep new programs coming. The advantages of using the PAC test are many and obvious. It reduces the uncertainties associated with estimating incremental measure costs; avoids the complexities of estimating potential non-energy benefits to participants and worrying about how to discount them; and above all, it provides a more rational basis for designing programs and incentive structures that are more compatible with the way by which utilities procure resources.
A move to the PAC test, though a necessary step, is hardly sufficient for a full alignment of investment decisions with the objectives of least-cost planning and avoiding externalities. Accomplishing these objectives requires a more comprehensive framework that not only includes an appropriate test, but also provides for a more rational basis for capturing the value of energy efficiency as a least-cost alternative to generating power and achieving environmental objectives.
Several states, such as Iowa, Oregon, Washington, and Utah, have attempted to factor in avoided externalities by incorporating adders in benefit-cost calculations. Such policies are welcome but must go further. These adjustments, usually in the range of 10 percent, are hardly reflective of the actual environmental impacts of power production. Difficulties in measuring these externalities are no doubt real, and it’s tempting to go for a quick fix. But if we are to heed the evidence of global climate change and its potential economic and social effects, and if we believe that energy efficiency can help mitigate them, it would be worthwhile to step up the task. Now more than ever it would be wise to take the long-term view and remind ourselves that for now energy efficiency remains, as a 2010 McKinsey & Co. report puts it, “a compelling global resource.”26
The distributional impacts of energy efficiency can be mitigated with creative programs that offer new products and services to a broad spectrum of consumers. Policy makers and regulators interested in adopting a guideline for their decisions might want to consider a simple, three-step process, a variant of which was proposed more than 20 years ago by Gelling and Chamberlin, two pioneers of energy efficiency analysis: 1) implement all programs that pass the RIM test, 2) eliminate all programs that don’t pass the PAC test, and 3) carefully evaluate the distributional impacts of the remaining programs.27
To some the current conditions presage a decline like what was experienced in the mid-1990s, a time when utilities apprehensive of the stranded-cost implications of open access mostly abandoned – or drastically curtailed – energy efficiency investments. The risks are real and all involve thinking short term. The big questions are what regulators will make of current conditions and how they will react. Implementing new guidelines for screening energy efficiency measures doesn’t require a grand-scale policy overhaul, merely refinements to well-established procedures. But the regulatory process being as it’s, the change is unlikely to catch on quickly.
Endnotes:
1. For a discussion of energy efficiency resource standards see “Extreme Efficiency,” by Haeri, Hossein and Eli Morris, Public Utility Fortnightly, September 2010.
2. California Standard Practice Manual: Economic Analysis of Demand-Side Management Programs, October 2001.
3. “Valuation of Non-Energy Benefits to Determine Cost-Effectiveness of Whole-House Retrofit Programs: A Literature Review,” by Amann, Jennifer, ACEEE Report Number A061, 2006.
4. “The Most Value Test: Economic Evaluation of Electricity Demand-Side Management Considering Customer Value,” by Hobbs, Benjamin F., The Energy Journal, Vol. 12, No. 2, 1991, pp. 67-91.
5. Demand-Side Management: Concepts and Methods, by Gellings, C.W. and J.H. Chamberlin, Fairmont Press, Liburn, Ga., 1993.
6. A National Survey of State Policies and Practices for the Evaluation of Ratepayer-Funded Energy Efficiency Programs, Report No. U122, by Kushler, Martin, et al., American Council for an Energy Efficient Economy, February 2012. See also Concept Paper: Discussion of and Recommendations for Issues Surrounding Energy Efficiency Savings Targets in Florida, prepared by GDS Associates for the Florida Public Service Commission, March 4, 2009.
7. “Least-cost Planning and Demand-side Management: Six Common Fallacies and One Simple Truth,” by Ruff, Larry, E., Public Utilities Fortnightly,” April 28, 1988.
8. “Ten Myths of Energy Conservation,” by Costello, Kenneth W., Public Utilities Fortnightly, March 19, 1987.
9. Planning and Pricing in the Energy Conservation Business, by Ruff, Larry E., Putnam, Hayes & Bartlett, June 1992.
10. For a comprehensive list of these benefits see “Evaluating Cost-Effectiveness, Causality, Non-Energy Benefits and Cost-Effectiveness in Multi-Family Programs: Enhanced Techniques,” presentation by Skumatz, Lisa, at the International Energy Efficiency in Domestic Appliances and Lighting Conference, 2006.
11. “Is it Time to Ditch the TRC? Examining Concerns with Current Practice in Benefit-Cost Analysis,” by Neme, Chris and Martin Kushler, Proceedings, Summer Study on Energy Efficiency in Buildings, American Council for an Energy-Efficient Economy (ACEEE), Monterey, Calif., August 2010.
12. Best Practices in Energy Efficiency Program Screening: How to Ensure that the Value of Energy Efficiency is Properly Accounted for, prepared by Synapse Energy Economic, for the National Home Performance Council, July 2012.
14. Op. cit., California Standard Practice Manual, p.18.
15. Op. cit., California Standard Practice Manual, footnote, p.11.
16. The Demand Response Cost Effectiveness Protocols, approved by the California Public Utilities Commission in 2010, establish the general approach for economic evaluation of demand response and provide clear guidance on how to treat incentives.
17. Public Service Commission of Utah, Order, In the Matter of the Proposed Revisions to the Utah Demand Side Resource Program Performance Standards, Docket No. 09-035-27 Oct. 7, 2009.
18. For an explanation of cost-effectiveness analysis in the context of demand response see California Public Utilities Commission, Final 2010 Demand Response Cost-Effectiveness Protocols, December 2010.
19. The Future of Utility Customer-Funded Energy Efficiency Programs in the United States: Projected Spending and Savings to 2025, by Barbose, Galen L., et al., Environmental Energy Technologies Division, Lawrence Orlando Berkeley National Laboratory, LBNL-5803E January 2013.
20. 2012 Carbon Dioxide Price Forecast, by Wilson, Rachel, et al., Synapse Energy Economic, Boston, Mass., February 2011.
21. For an excellent discussion of the topic see “Renewable Portfolio Standards and Cost-Effective Energy Efficiency Investment,” by Mahone, A., et al., Viewpoint, Energy and Environmental Economics Inc., San Francisco, Calif.
22. British Columbia Utilities Commission Act, Demand-Side Measure Regulation, B.C. Reg. 326/2008, November 2008
23. For a discussion of this point see Demand-Side Management Planning, by C.W. Gellings and J.C. Chamberlin, the Fairmont Press, Lilburn, Ga., 1992, pp. 277-283.
24. Vermont Department of Public Services, Electric Energy Potential for Vermont, by GDS Associates and Cadmus, April 2011.
25. Direct Testimony on behalf of NV Energy, by M. Hossein Haeri, Public Utilities Commission of Nevada, Docket No. 12-06, October 2012.
26. “Energy Efficiency: A Compelling Global Resource,” McKinsey & Co., 2010.
27. op. cit., C.W. Gellings and J.C. Chamberlin, p. 281. In the original version, the authors recommend the TRC and not the PAC test.
