How EPA can establish a U.S. GHG Program for the Electricity Sector.
David P. Littell is a commissioner on the Maine Public Utilities Commission, and served as vice chair of the Regional Greenhouse Gas Initiative in 2012 and 2013, and as its chairman in 2010 and 2011. This article is based on unpublished comments the author presented at industry events in September and November 2013. This article represents his views and not those of any organization.
The U.S. Environmental Protection Agency (EPA) is moving forward to establish a Federal Clean Air Act program to reduce the greenhouse gas emissions of the electric power sector. It has already proposed rules for new power generators and will do so soon for existing electricity generators.

The EPA can draw from the experiences of 10 states, representing 29 percent of the U.S. economy, and two provinces, representing 32 percent of the Canadian economy, which have carbon markets in operation valued at over $1 billion. The five-year old Regional Greenhouse Gas Initiative (RGGI) is the first market-based regulatory program in the United States to address greenhouse gas emissions. California and Quebec are now implementing economy-wide GHG reductions programs launching their power sector components a year ago in 2013.
The states, utilities, and electricity sector have led the way with precedents and innovations from which the EPA can draw. Thirty states have renewable energy or alternate energy standards, and seven states have established voluntary standards, for a total of 37 states. Fuel conversions are occurring in virtually every state, most often as a market response to fuel prices, but often also assisted by market rules and regulatory decisions. At least 25 states have dedicated funding for energy efficiency or energy efficiency resource standards. The effectiveness and efficiency of various programmatic initiatives can be measured and verified as part of the best system of emissions reduction.
The states, utilities, and electricity sector have led the way with regulatory precedent and innovations from which the EPA can draw. Yet how the federal government will incorporate, coordinate with, and build upon these existing initiatives isn’t clear.
The two key questions are: How deep will EPA’s reduction guidelines go? Once we know how deep the regulatory dive will be, the second question is how can utilities, generators, and regulators find the most cost-effective GHG reductions? President Obama’s 2013 climate action announcement and EPA’s recent and pending actions make these very timely questions.
Market-Based GHG Programs
 Figure 1 - North American CO2 Reduction Programs
Carbon emission trading has been adopted in 51 countries, states, and provinces, plus five major cities in China.1 At the beginning of 2014, five major North American programs are aimed at reducing the power sector’s greenhouse gas emissions – namely, RGGI, California’s AB 32, Quebec, Alberta, and British Columbia. Three of the five programs distribute government-issued CO2 allowances and then require regulated entities to secure allowances or government approved offsets to cover emissions proportionate to their GHG emissions. Alberta’s program is an intensity-based system that requires the purchase of offsets, emissions performance credits, or the payment of fees. The fifth program in British Columbia imposes a carbon tax. (See Figure 1).
• Regional Greenhouse Gas Initiative: Implemented in 2009, the Regional Greenhouse Gas Initiative (RGGI, pronounced “Reggie”) has now achieved more than five years of quarterly allowance auctions with its 22nd auction in December 2013. RGGI is a regional program coordinating nine separate state programs that function together in Northeastern and Mid-Atlantic U.S.
RGGI paved the way in North America for market-based GHG emission reduction programs. RGGI is composed of nine states – Maine, New Hampshire, Vermont, Massachusetts, Rhode Island, Connecticut, New York, Delaware and Maryland – with a total combined gross domestic product of $2.4 trillion, representing 16 percent of the U.S. economy. These nine states coordinate to effectively create a single unified market for auctioning and trading carbon allowances.
RGGI’s first goal was to reduce carbon emissions from the power sector 10 percent by 2018. This reduction goal has already been reached; emissions are more than 40 percent below 2005 emissions. (See Figure 2).
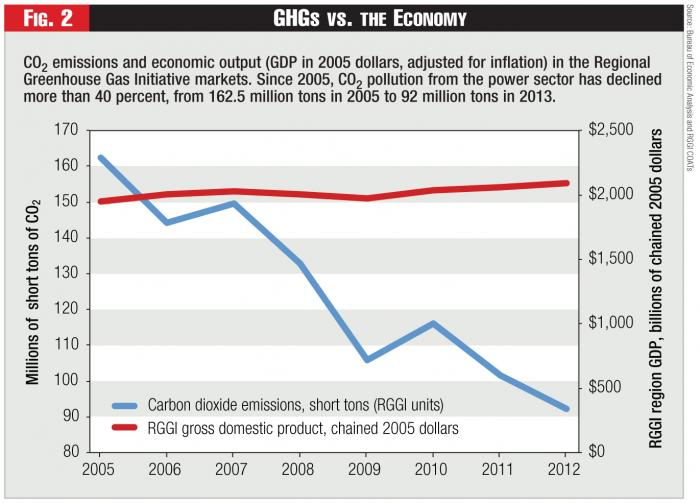 Figure 2 - GHGs vs. the Economy
The next step for the RGGI states was implementing changes to lock in these reductions. The nine RGGI states have just completed rule changes to lower the current RGGI cap by an additional 45 percent starting in 2014 and then further reduce the cap 2.5 percent each year from 2015 to 2020. The resulting power sector cap will be 50 percent lower than the original cap. (See Figure 3).
RGGI regulated entities comply by purchasing carbon allowances at quarterly auctions or on the secondary market, or by purchasing carbon offsets generated by approved GHG reduction projects. Proceeds from the quarterly allowance auctions are distributed to the states. By 2011, the states had reinvested 70 percent of RGGI auction proceeds in energy efficiency, clean and renewable energy, GHG abatement, direct bill assistance, and other consumer benefit programs. This early $617 million from RGGI was reinvested in the region’s energy future, a direct benefit to 2.9 million households and 7,400 businesses. State RGGI investments in energy efficiency and other strategic energy programs to date are projected to reduce lifetime GHG emissions by approximately 8 million tons of carbon dioxide pollution.
Reinvesting auctioned allowance proceeds in efficiency and other energy investments yields macroeconomic benefits. An independent report by the Analysis Group found that RGGI proceed investments through 2011 are generating $1.6 billion in net economic benefits, putting $1.3 billion in energy bill savings back into the pockets of consumers, and creating 16,000 job-years in the RGGI states. RGGI’s emission reductions have been realized as the regional economy has grown more than 7 percent (after inflation) since 2005.2 And these benefits have been achieved with allowance auction prices ranging from $1.86 to $3.51 per ton of CO2.
The nine RGGI states have built upon this foundation and are implementing a series of program upgrades – a RGGI phase II – to lock in reductions to date and make further GHG reductions. Modeling predicts an additional 80 to 90 million tons of cumulative emission reductions by 2020, compared to the original RGGI program. The program revisions are modeled to have a small net impact to consumers’ electricity bills, with the average electricity bill increasing less than 1 percent (considering only cost without economic benefits). Macroeconomic REMI modeling indicates that RGGI’s phase II will yield additional economic benefits: an additional $8 billion increase to the nine states’ economic production, more than $7 billion in real personal income, and an additional 125,000 job-years, in addition to the benefits already achieved from RGGI’s original design and operation for the first phase from 2009 through 2013.
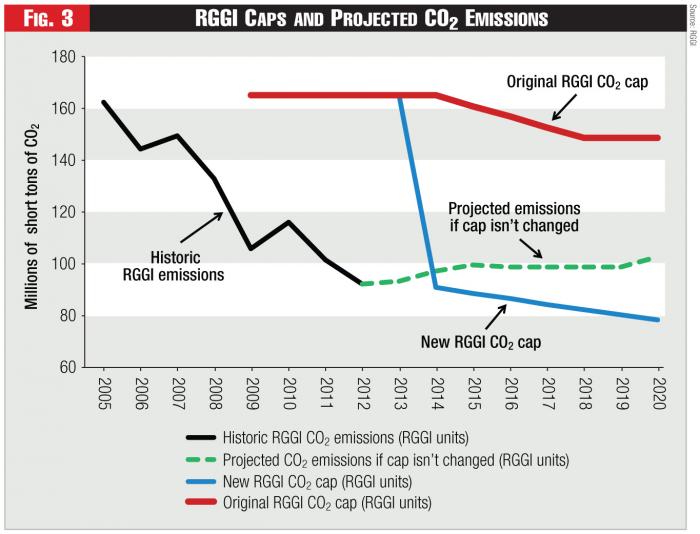 Figure 3 - RGGI Caps and Projected CO2 Emissions
The RGGI states’ experience suggests that it’s feasible to cut power sector CO2 emissions by half – 50 percent reductions – over a couple decades through a combination of market responses, fuel switching, market-based carbon regulation, multi-pollutant rules, energy efficiency, renewable energy development, and demand response initiatives.
• California: The largest single market-based program in North America is California’s AB 32. It’s largest by scope of sectors and the largest single jurisdiction. California has the single biggest economy of any U.S. state, with a gross state product of approximately $2 trillion, representing approximately 13 percent of the U.S. economy. If California stood alone as a nation, its economy would be among the top 10 nations in the world.
California’s program, often referred to as AB 32 after the legislation mandating the program, went into effect on Jan. 1, 2013. The program initially covers the power industry and certain industrial sectors in 2013 and 2014 and will be extended to the transportation, residential, and commercial fuel sectors in 2015. The program aims to reduce carbon emission levels in these sectors to 1990 emission levels of 427 million metric tons by 2020.
Regulated entities will comply by acquiring either state-issued carbon allowances or approved carbon offsets. California initially is distributing free allowances to electric utilities (not generators), industrial facilities, and natural gas distributors. This free allocation decreases over time. Other allowances must be purchased via quarterly state auctions or in the secondary market.
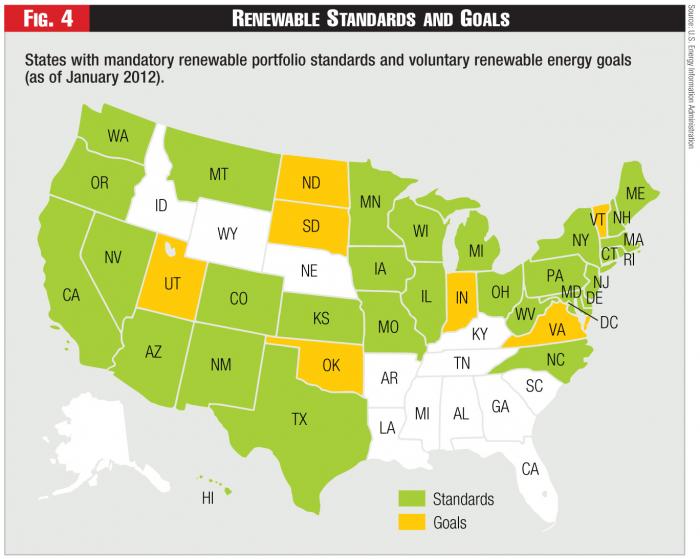 Figure 4 - Renewable Standards and Goals
Investor-owned utilities must sell their free allowances through the state quarterly auctions, and then use these auction proceeds to provide ratepayer benefits, such as a “climate dividend” credit on residential ratepayers’ bills. Proceeds from the state’s sale of allowances will be used to fund investments in clean energy, greenhouse gas abatement, and environmental projects, which will further reduce emissions and provide complementary energy and consumer benefits.
• Quebec: The second largest economy among the Canadian provinces, Quebec also has implemented a broad GHG program. Quebec’s 2011 GDP of C$358 billion represents approximately 20 percent of the total Canadian economy. Like California, Quebec’s program initially will encompass the power and industrial sectors in 2013, and be extended to the transportation, residential, and commercial fuel sectors in 2015. Quebec’s emission reduction target is based on a 2020 cap of 54.7 million metric tons, which would reduce its GHG emissions to a level 20 percent below its 1990 emissions. Like California, Quebec initially is distributing free allowances to participants, with the number of free allowances decreasing over time. Regulated entities will comply by matching their GHG emissions with carbon allowances, early reduction credits, or Quebec-approved carbon offsets.
In late 2012, Quebec approved a linkage of its program with California’s. This last April, California Governor Jerry Brown approved the linkage with Quebec.
• British Columbia and Alberta: The Canadian province of British Columbia uses a market-based carbon tax to reduce GHG emissions. British Columbia has a carbon tax of C$30 per metric ton of CO2 equivalent emissions. Carbon tax rates are then established for gasoline, diesel (light fuel oil), jet fuel, natural gas, propane, coal, and other fossil fuels. The carbon tax applies to sale or use of fossil-fuels.3
Alberta has an intensity-based emissions program intended to stabilize GHG emissions from entities emitting more than 100,000 metric tons of carbon dioxide per year. Neither British Columbia nor Alberta distributes or auctions government-issued carbon allowances. B.C.’s carbon tax is a simple market-based sales or use tax on carbon intensity, whereas the Alberta program is more like an environmental program focused on regulating emissions above a specified level. For this reason, B.C.’s program might be considered market-based, but not Alberta’s. Either approach can be effective if designed carefully to incentivize efficient carbon reductions and avoid inefficient market and regulatory signals.
Costs, Benefits, and Competitiveness
In its efforts to establish effective approaches to GHG reduction, EPA can build upon the experience of the North American states and provinces and more than 50 foreign jurisdictions to assess what works and what systems might be most efficient in the U.S. context.
The OECD has produced an informative set of studies. If we needed a sophisticated set of studies to tell us that markets produce the most cost-effective means to reduce greenhouse gases, the OECD does just that. At the end of 2013, the OECD issued a report, Effective Carbon Prices, and a policy paper, “Climate and Carbon Aligning Prices and Polices,” which examine the mechanisms in place to reduce GHG emissions in 15 OECD member countries including the U.S., the E.U., and non-OECD member China.4 The OECD analyses indicate that carbon markets are roughly 94 percent more efficient at reducing GHG emissions than other mechanisms such as direct subsidies and feed-in tariffs.5
The OECD study finds that emissions trading is by far the most cost-effective carbon reduction approach – 16 times more efficient or roughly 94 percent more efficient than capital subsidies.6 A carbon tax is the second most cost-effective approach. Capital subsidies are estimated to be least cost-effective overall. Capital subsidies estimates go as high as €800 per ton of CO2 abated in individual countries.7 The carbon price across the GHG emission trading programs is estimated at €10 per ton of CO2 abated from market-based emissions trading versus €169 for feed-in tariffs and €176 per ton of CO2 abated for capital subsidies in these countries.8 This comparative price conclusion isn’t exact, and 94 percent more efficient9 is undoubtedly false precision given the scale of the analysis – but it’s something to consider carefully. This OECD report is consistent with our American sense that well-designed markets produce the most cost-effective means to efficient outcomes.
Using that American faith in markets to efficiently drive costs down, RGGI and California’s program allow the U.S. to add efficient GHG markets to those markets we have designed for energy, capacity, ancillary energy services, and renewable energy. The U.S. and other North American carbon markets are trading at the low end of the OECD analyzed estimates for carbon prices. Carbon pricing is a function of market mechanisms working to discover the lowest GHG abatement opportunities together with supply and demand of carbon allowances and other market-specific dynamics such as fuel conversions, relative fuel prices, and even weather.
Economic efficiency in abating carbon emissions is hardly the only measure of success of these programs. Carbon markets don’t operate in isolation from related markets, market structures, and other complementary programs. Low load growth made possible by substantial investments in energy efficiency and demand response capacities also facilitate a transition to more efficient generation units, while Clean Air Act requirements for conventional priority pollutants and air toxics help lower both traditional air pollutants and GHG emissions.
Macroeconomic and inter-sector considerations are appropriate in any new market design. For the RGGI states, the initial program design in 2005 through 2008, as well as the 2012 and ’13 program review, examined the macroeconomic effects of the RGGI program on state and regional economies. The RGGI states examined macroeconomic effects using the REMI model, based on the outputs of IPM model electricity market scenarios, to ensure the program minimizes costs and maximizes economic benefits, while achieving GHG emission reductions of roughly 50 percent. The RGGI states conducted extensive stakeholder outreach to receive feedback and comments on those economic analyses.
Certainly some of the states considered the competitiveness of particular sectors. Maine, for example, has a much higher economic concentration of traditional manufacturing than the rest of the RGGI states. A manufacturing economy is different from a service-sector economy with different emissions profiles, different generation profiles, different economic effects, and different cost-effective emission reductions opportunities. Each state knows its economy better than the federal government can and will be able to sculpt the best system of emissions reduction for its own power sector. EPA should set the goal posts and let the states develop the game plans to get across the goal line.
An Inchoate GHG Program
Supreme Court Justice Louis Brandeis wrote that “American states act as laboratories of democracy,” meaning the states experiment with solutions to social and economic ills and create a portfolio of successful and unsuccessful mechanisms to address issues requiring action. There’s no better illustration of Justice Brandeis’s aphorism than the varied states’ programs aimed at reducing GHG emissions while growing their economies. With programs that include Colorado’s “Clean Air, Clean Jobs” legislation, Iowa’s three-decade commitment to developing wind power, market-based carbon reduction programs in California and the RGGI states, and RPS programs in 30 U.S. states, the EPA has a rich variety of models upon which it can build a federal program.
The task before EPA is determining how best to fulfill the president’s directive and create a federal system that provides states with the flexibility to take advantage of market-based mechanisms and other cost-effective tools, while still ensuring that significant reductions are realized in each state. EPA can take advantage of state and regional expertise regarding their power sectors by adopting a common federal scheme that empowers state officials to achieve GHG reduction requirements based on either a rate-based or mass-based reduction guideline.
If EPA leaves the standards or implementation to the states for RPS, energy efficiency, and GHG reductions in general, a minimal set of common metrics for measurement, accounting, and compliance presumably would be necessary. Coupling the approach above with a common accounting or measurement scheme would provide greater accountability and measurement of real, additional, verifiable, and enforceable reductions.
Enabling such a market-based approach would spur innovation among the states and allow the U.S. to meet our climate responsibilities in ways that improve our global competitiveness, strengthen the economy, and accelerate the transition of our electricity infrastructure toward a more efficient and reliable system.
President Obama’s Climate Action Plan announcement in June 2013 likely will have the most significant effect on market-based GHG emission reduction programs in North America over the short and medium term. The president specifically instructs the EPA to reduce carbon pollution from electrical generation plants, the single largest source of GHGs in the U.S., accounting for roughly one-third of U.S. GHG emissions. This is, of course, the exact sector regulated by RGGI, an initial sector regulated by California and Quebec, and a sector subject to B.C.’s carbon tax, so these state and provincial programs provide North American regulatory precedent, operational models, and potential compliance vehicles for a U.S. and Canadian national program.
To implement Obama’s plan for electricity plants, a June 25 presidential memorandum directs the EPA to work expeditiously to complete carbon pollution standards for both new and existing power plants. The president’s memo directed the EPA to issue revised rules for new power plants by Sept. 20, 2013; proposed rules for modified, reconstructed, and existing power plants under Sections 111(b) and 111(d) of the Clean Air Act by June 1, 2014; and final rules by June 1, 2015, with state plans due no later than June 30, 2016.10
There’s much discussion in the U.S. on what standards the EPA might propose for each category of electrical plants. Among the issues EPA is examining is whether the EPA can allow current state GHG reduction programs, renewable energy requirements, and energy efficiency programs to serve as compliance mechanisms under the Clean Air Act. In his Climate Change Action Plan, the president asks the Environmental Protection Agency to build on “state leadership” and to “provide flexibility in developing the standards.” The June 25, 2013 instruction to the EPA specifically directs the EPA to “build on State efforts to move toward a clean power sector” and to “include in the guidelines addressing existing power plants a requirement that States submit to EPA the implementation plans required under section 111(d) and the Clean Air Act” no later than June 30, 2016.11 While it’s clear that Pres. Obama intends that the EPA should build upon programs like RGGI and California’s, it isn’t clear exactly what this means.
For existing power plants, the presidential memo envisions U.S. states with a central role in implementing standards as well establishing standards. The memo states that the EPA is to work with the states “as they will play a central role in establishing and implementing standards for existing power plants…”12 Perhaps most significantly, the president directs the EPA to ensure, to the extent possible, that its regulatory approaches “allow the use of market-based instruments, performance standards, and other regulatory flexibilities.”13 In addition to calling out a role for states in establishing standards under the federal program – a role potentially different from the typical minimal standards under the Clean Air Act – regulatory flexibility and market-based instruments are specifically called out in the memo to EPA. This ability to amplify the best thinking among the states, acting as laboratories of democracy, is an underpinning of our federal-state system.
If we needed any further indication the U.S. states will play a critical role in the U.S. program, EPA Administrator Gina McCarthy, who was involved in the development of the RGGI program as a state commissioner, said in her inaugural speech as EPA administrator, “I know as well as anyone, that when it comes to cutting carbon, there is a lot we can learn from our states… [W]e at EPA want to build on and complement these efforts already underway.” EPA Deputy Administrator Bob Perciasepe told state legislators last summer that state and federal leaders need to build on past successes as they pursue reductions in GHG emissions.
Building on State Efforts
A potential avenue for the EPA to build upon state efforts – as the president directs – is to allow market-based GHG reduction programs, such as RGGI and California’s, to serve as compliance mechanisms. If the EPA selects that route either directly or through a state implementation plan (SIP) type of approach – which is more typically associated with Section 110 of the Clean Air Act, but also appears under Section 111(d) – additional states would have the option of starting their own market-based GHG programs or joining and linking with programs like RGGI or California’s.
The benefits of these existing market-based mechanisms are that they drive compliance costs down, are very cost-effective, offer compliance flexibility, and have been tested and are fully operational. RGGI and California’s AB 32 also have broad support in 10 U.S. states representing 29 percent of the U.S. economy. Moreover, the RGGI states and California listened to regulated companies and investors when establishing their programs, and designed carbon markets to combine compliance flexibility and market trading mechanisms that facilitate cost discovery and market stability, encouraging and rewarding investment in carbon abatement and low-carbon technologies.
Both RGGI and California’s program designs incorporate: tradable allowances; mechanisms that support a secondary market for those allowances; a reserve price and cost-containment reserve that encourage price stability within a broad price range; allowance banking; and limited use of offsets as an alternative compliance mechanism.
When they proposed a reduction in the RGGI cap, the RGGI states decided quite purposefully to support the RGGI market investment expectations of those holding a private bank of allowances. To the extent there’s a financial benefit from prices rising for existing allowances in circulation when the supply is reduced, that benefit will be realized by private allowance holders as the cap tightens. While these existing RGGI and California market mechanisms appear consistent with the president’s mandate that EPA’s regulatory approach “allow the use of market-based instruments, performance standards, and other regulatory flexibilities,” they might not be sufficient for compliance with a federal program until we see EPA’s proposal in June 2014.
Additional emission reductions and economic benefits directly result from each state’s decision on how to invest their allowance proceeds. Both RGGI and California have set up systems whereby states invest allowance proceeds in energy efficiency, renewable energy, and other strategic energy programs, use the funds to provide ratepayer relief, or fund other consumer benefit programs. Strategic reinvestment provides significant macroeconomic and employment benefits to states as well as additional emission reductions from energy efficiency and renewable investments. These economic benefits more than compensate for the cost of the program to bring net economic benefits to states.
111(d) Parameters
The EPA faces many considerations as it seeks to create a Section 111(d) framework. Here are some of the more interesting questions:
Can EPA aim at global temperature increase limitation (temperature increases no more than 2°C) or an atmospheric level of GHGs (below 350, 400 or 450 ppm)?
What will the national reduction goal be? If there’s a reduction goal, will it be limited to the president’s 17 percent in the Copenhagen Accords, or will it go beyond 17 percent? Over what time frame?
How will any reductions be divided out by state, region, utility, or facility?
How does the EPA set guidelines – i.e., nationally, or by geographic region, electrical region (ISO-RTO), or state, utility, facility, or unit type? What flexibility might regions, states, or utilities have to propose alternatives? What flexibility might states or utilities have to trade obligations, allowances or credits? What credit will be given to states for programs and carbon reduction performance achieved prior to EPA regulation?
Will the standards be markedly different for new power plants than for existing, modified or rebuilt power plants?
Will there be unit-specific regulatory jurisdiction thresholds? Electrical plants of 25 MW or higher capacity are regulated under the SO2 program. Under the former EPA New Source Performance Standard proposed for carbon dioxide emissions, plants of 73 MWe heat input or above were to be regulated.14
Will EPA’s guidelines allow for or mandate a rate-based standard (e.g., emissions per MWh) or a mass-based standard (e.g., tons per year)? Would a rate-based standard be national, by state, utility, facility, or unit type? Should the performance standard be a state emissions inventory, as is usual practice under Section 110 of the Clean Air Act? How will a reduction goal be built into the standard? And will the reductions be allocated and measured nationally, by state, utility, facility, or unit?
A carbon allowance market requires a mass-based approach. The cap is a quantity-based limit on emissions. On the other hand, a mass-based approach doesn’t require a market. A mass-based reduction approach can be married to a carbon emissions rate. That said, a carbon emissions rate isn’t welcomed by some states because of the fear the rate will be linked to either the emissions intensity rate from a new gas-fired combined cycle generator, as EPA did in its New Source Review Standard, or linked to the emissions intensity rate of an advanced coal gasification unit with carbon sequestration.
That’s perhaps why the state of Kentucky, in comments to EPA on 111(d), calls for a mass-based approach and says that such an approach could enable the state to achieve a 38 percent reduction in power sector carbon emissions by 2030 and an 80 percent reduction by 2050. Kentucky’s proposal – from the most coal-dependent U.S. state – is well-developed and well-reasoned. It’s a feasible, courageous proposal from the people of Kentucky to work to protect the state’s workers while transitioning to a low emission economy.
Tradable performance standards based on rate-based reductions could support a carbon-emissions rate as well. But a tradable performance standard is far less transparent and relatively complex to administer, verify, and enforce. The transparency, administration, verification, and enforcement complexity of a tradable performance standard regime would be exacerbated if each state establishes and measures a performance standard in a different way. Tradable performance standards limited to specific utilities would exhibit these issues more acutely, and so restrict the opportunities for cost-effective GHG abatement. A major advantage of a mass-based approach that uses a cap is that the cap does all of the work; the cap acts as a tracking, compliance, verification, and enforcement mechanism. Because the concept of a ton of CO2 emitted per allowance is simple and understandable, a cap is an extremely transparent compliance mechanism.
Will there be a baseline from which reductions in GHGs are assessed? It’s unlikely a baseline will use the year 1990, as the Kyoto Protocol did. Instead, 2005 could be used as a potential baseline, as it’s already used by California and because the president used it in the Copenhagen Accord principles. Baselines also can use an average of different years as RGGI did for 2000 through 2002. However, it’s an open question how and whether any baseline approach would incorporate U.S. Energy Information Agency projections of emissions growth or reductions in electricity load growth.15
Should utility sector GHG regulation target solely CO2 or will they regulate the other five GHGs, specifically methane and nitrous oxide for the power sector? Leaving methane and nitrous oxide out leaves cost-effective abatement opportunities on the table.
Will the standards of performance in effect force the use of certain technologies? What technologies or processes are available to reduce, capture, or avoid GHG emissions, and will reduction goals be limited to applications of these specific technologies? The EPA has a strong history of successfully forcing technologies such as catalytic converters in the automobile industry, and this approach has been upheld in court under other sections of the Clean Air Act.
If non-utility sector credits or offsets can be considered, should there be a linkage to the electricity sector – e.g., credits for reducing petroleum in transportation with electrical vehicles? Will it be important for a power-sector GHG program to capture net reductions that result when transportation fuel shifts from petroleum to electricity?
How will reductions be measured? Who will set the standards and the methodologies? Measuring carbon dioxide emissions from fossil-fueled power plants is straightforward. Measuring emissions from shifting generation to renewables is harder, but it can be quantified in a verifiable and robust fashion. Measuring emission reductions from some types of energy efficiency measures can involve difficult and yet-to-be-settled methodologies.
Will states maintain their traditional primary role in Clean Air Act (CAA) implementation under a utility 111(d) program? Is there an opportunity for state roles to become even broader in setting state-specific GHG policies, goals, and laws? How could that work – i.e., regarding baseline, reductions goals, compliance, and enforcement following traditional Clean Air Act SIP process under Section 111(d), which is different from Section 110?
How permissible might be market flexibility and support mechanisms such as banking, borrowing, and price floors and ceilings? Banking ensures that the value of allowances is maintained year-to-year like most investments, and the value of allowances doesn’t expire year-to-year. Borrowing is a type of futures transaction by regulation. Price floors and ceilings ensure the market will neither crash nor spiral to unanticipated costs.
There is a real flexibility advantage in encouraging and allowing multi-year compliance strategies. The RGGI program uses a three-year compliance approach. Regulated units have flexibility to address short-term variations in emissions due to fuel price volatility, unexpected shutdowns, and ISO-ordered uneconomic dispatch without affecting the enforceability or effectiveness of reductions.
Can and should trading between states or facilities be allowed under Section 111(d)? Working regionally, a system can align with the regional nature of the electricity grid. Electricity grids allow electricity to flow from most efficient producer to load wherever located. As a result, generation and emissions within a region might not always trend in unison, with emission increases in some locations due to market fundamentals offset by emissions decreases elsewhere. While a regional mass-based system allows emission increases in some locations to reap the benefits of more efficient sources in those locations while emissions might decrease elsewhere, the issue of state-by-state accounting, if required, could impede regional cooperation.
Using a mass-based approach could make the cap federally enforceable, but leaves it up to the states how to apply a portfolio of initiatives to get there. For a rate-based or portfolio approach, individual measures such as efficiency programs and renewable standards might become federally enforceable.
Can efficiency be used as a credit, allowance, or qualifying emissions reduction?
Can renewable or nuclear electricity generation be credited? How would such a credit be calculated to determine GHG emissions avoided – e.g., using average regional GHG profiles or specifically based on the marginal unit dispatch for that hour or six-minute increment?
Sequestering carbon in sustainably managed forests is a proven process and very cost-effective, but could offsets or credits from other non-utility sectors also be used? EPA has given some indication that offsets outside immediate regulated electrical generation sector might be difficult to recognize under the Clean Air Act.
Counting Renewable Credits
With an eye to energy independence, resource diversity, and GHG reductions, at least 30 U.S. states have established renewable portfolio standards (RPS), renewable energy standards (RES), or similar policies. The 30 states with RPS or similar standards represent 75 percent of the U.S. economy, or $11.6 trillion in combined state domestic products. These RPS policies applied to 54 percent of U.S. retail electricity sales in 2012.16 Seven additional states have voluntary standards, for a total of 37 states. (See Figure 4). The voluntary renewable markets accounted for an additional 50 percent in demand for new renewables, in comparison with the demand necessary in the mandatory compliance markets in 2012.17
An RPS or RES compliance mechanism uses an energy-based (rather than emissions-based) tradable energy commodity –
a renewable energy credit or certificate (REC). An REC represents the generation of 1 MWh of renewable energy. Renewable portfolio standards require utilities and other load-serving entities (LSE) operating in that state to source a percentage of their electricity from renewable energy resources. RECs are used by utilities and LSEs to meet these compliance obligations.
Although each REC represents 1 MWh of renewable energy generation, the prices for RECs vary widely due the significant differences among state renewable portfolio standards, and the supply and demand in 30 different markets with different classes of RECs within each state. Thus there’s no unified market for RECs, but rather 30 different and disparate markets evidencing a significant market-design issue. In fact, many states have multiple categories of eligible classes, so there are far more than 30 different REC markets. The nine RGGI states have more than a dozen different types of RECs, but one common carbon emissions allowance that’s recognized in all nine states. When markets are segmented and divided, market mechanisms can’t perform well to drive down costs to the lowest cost providers. The balkanized REC markets are less liquid, and as a result less efficient due to this relative illiquidity. The benefits of using markets to stimulate commercial activities and innovation can be lost when markets are balkanized among 30 states and many classes.
Nonetheless, the RECs are tradable in disparate markets, and can be converted into emissions reductions based on calculations or methods that are rigorous and verifiable if not yet fully settled. Based on the widespread adoption of RPS or equivalent programs, EPA might consider guidance for incorporating credits for these complementary programs into a federal U.S. program, as well approving methods to convert RECs (many different REC types) to recognized GHG reductions.
Better yet, EPA could allow for credit from state renewable programs in a manner that provides a common set of metrics across REC markets. EPA action might support robust GHG reductions accounting based on RPS, RES, and similar state programs. Providing a set of GHG-reduction metrics could provide a common basis to integrate these separate markets into something more recognizable to energy sector players as a unified renewable energy market across the 30-plus-seven states. Use of federal authority to facilitate commerce among the states reflects a key principle behind the U.S. Constitution. A federal system of government rather than a loose confederation of states best facilitates commerce among the states for the mutual benefit of all.18 EPA action allowing credit for existing market-based programs and from existing RPS policies could potentially support integration of regional or even a national REC market.
Are the States Ready?
For those of us at utility commissions, we need to consider whether the state energy-utility-environmental structures in place are adequate for these tasks. The fundamental approaches and tools used by public utility commissions today were designed at the start of the 20th century – 100 years ago – and were intended to meet an entirely different set of challenges, primarily the regulation of economic monopolies created by economies of scale in the electrical, telephone, natural gas, and railroad industries.
A mismatch is apparent between PUC tools and the challenge of global warming. Most commissions have little jurisdiction or expertise on greenhouse gas economics and cost-effectiveness of different abatement approaches utilities or the generation sector might adopt. Fortunately, staff members who have studied energy, utility economics, and environmental issues in recent years bring this expertise into commissions and the energy sector.
The federal-centric debate of what EPA might do – what the federal government should do and shouldn’t do – risks masking self-examination of the state structures between utility commissions, energy offices, environmental agencies, utilities, and energy markets. Perhaps our state structures also need a makeover to meet these challenges and best serve the ratepayers, utilities, and citizens for whom we work.
Endnotes:
1. The new Australian government has announced it intends to repeal Australia’s program and China is introducing seven carbon market pilots in two provinces and five cities beginning in 2013.
2. U.S. Department of Commerce, Bureau of Economic Analysis.
3. See British Columbia, Ministry of Finance, (Since different fuels generate different amounts of GHG when burned, $30 per ton of CO2 equivalent must be translated into tax rates for each specific type of fuel. For example, effective July 1, 2012 the rate for gasoline is 6.67 cents per litre. The tax rate for diesel is slightly higher at 7.67 cents per liter due to the higher carbon content, while the tax on propane is lower on a per liter basis.)
4. See OECD Effective Carbon Prices, OECD Publishing, Paris (Nov., 2013); OECD, “Climate and Carbon Aligning Prices and Policies,” OECD Environment Policy Paper (Oct. 2013), at pp. 30-31 drawing research from the U.S, U.K, Spain, South Africa, New Zealand, Korea, Japan, Germany, France Estonia, Denmark, China, Chile, Brazil, and Australia.
6. See Bloomberg.com, “Carbon Markets 94% Cheaper Than Renewable Support, OECD Says,” by Mathew Carr (Oct. 9, 2013).
8. OECD, “Climate and Carbon Aligning Prices and Policies,” at Fig. 5, p. 31, citing OECD Effective Carbon Prices, supra at note iv.
10. Presidential Memorandum for the Administrator of the Environmental Protection Agency of June 25, 2013, Federal Register, Vol. 78, No. 126 (July 1, 2013), §§ 1(a) and 1(b).
14. Exceptions (i.e., exemptions) to the 73 MWe heat input threshold formerly proposed by EPA laid out in proposed new CFR section (§60.5510(b)) state that (1) municipal waste combustors; (2) commercial or industrial waste combustors; and (3) “transitional sources” would not fall under the rule.
15. A baseline is necessary if EPA establishes performance standards based upon mass of carbon emissions reductions over time. Performance standards based upon atmospheric or temperature levels would have an inherent baseline of ~270 ppm and historic average temperatures over recorded human history (e.g., 2000 years). While in theory, the baseline chosen for GHG emissions should be based on climate physics and economics regarding how much carbon emissions should be reduced in what sectors, practical regulatory considerations will dictate the need for a baseline to measure reductions under the structure of the Clean Air Act and to measure compliance with the performance standard.
16. Lawrence Berkley Livermore Laboratory, Renewable Portfolio Standards in the United States: A Status Update (2012).
17. J. Heeter and T. Nicholas, Status and Trends in the U.S. Voluntary Green Power Market (2012 Data), p. 4, fig. 1, Comparison of compliance and voluntary markets for new renewable energy, 2005–2012, NREL Technical Report /TP-6A20-60210 (October 2013).
