
Where is it Most Relevant Today?
Cameron Brooks is founder and President of E9 Insight, a Boulder, Colorado firm that tracks regulatory proceedings and provides customized research for U.S. electric utility industry companies, agencies, and organizations active in establishing policies that advance clean energy resources.
Last fall, the National Association of Regulatory Utility Commissioners embarked on a yearlong project to look closely at questions surrounding rate design. They acted in the face of rapidly advancing distributed energy adoption.
In the words of NARUC's then-President Travis Kavulla, the goal was to develop a manual that could serve as a resource for commissioners as they "grapple with the complicated issues of rate design for distributed generation."
NARUC established a new subcommittee on rate design. It was charged with developing the manual to assist jurisdictions in navigating the challenges, considerations, and policy development related to compensating distributed energy resources.
The manual drew great attention, with over seventy parties providing input on a draft released for public comment last July. And while the manual is intended to serve as a resource for rate design, it also recognizes that the ratemaking process is often said to be more art than science.
The manual provides a great overview of a wide range of distributed energy resources, but also makes clear that there are many related issues that could not be addressed in this initial effort.
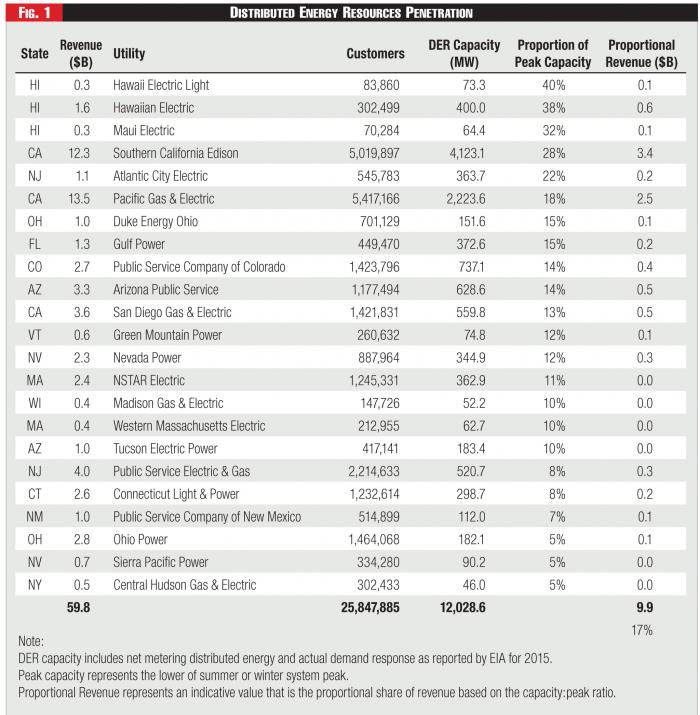 Figure 1 - Distributed Energy Resources Penetration
"For example," the authors write, "this Manual does not address utility business model discussions, utility compensation and revenue recovery options, and larger market development solutions beyond simply addressing DER."
They add that "concepts such as performance-based ratemaking, distribution system operators, the role of the utility in providing technology to customers, or distribution utility system planning are not covered in depth in this Manual, but are important conversations to have considering the current state of the utility industry."
The manual does make clear that the "traditional means of regulation, rate design, and planning largely assume the utility will meet all demand with large, central-station generation facilities," but that "relying on solutions of the past does little to meet the needs of the future."

In this spirit, they suggest that there may need to be an expanded definition of a "resource," noting "regulators are beginning to see the need for distinction between types of DER with respect to the relative values/costs each may have for the system."
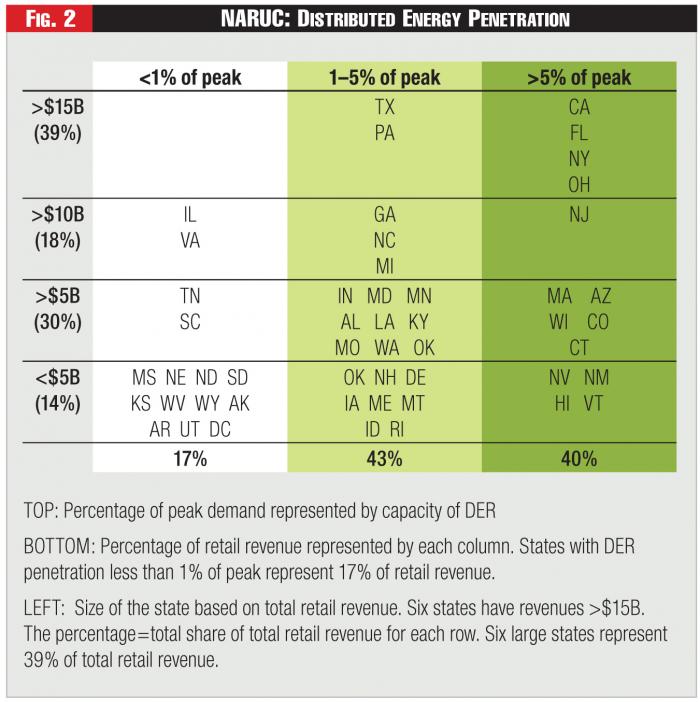 Figure 2 - NARUC: Distributed Energy Penetration
Still, one of the biggest questions concerns what constitutes a high level of distributed energy resources penetration. As the manual notes, "The level and pace of adoption of DER in a system is important in the determination of what, if any, policy reforms are needed."
When asked during the NARUC commissioners' annual meeting in November, subcommittee chair Chris Villarreal, citing the manual, suggested that the level is "somewhere near five percent adoption."
Using the latest information from the Energy Information Administration, we've taken a first look at which utilities and jurisdictions have adoption rates near this level.
There is no one reported metric that describes distributed energy resources adoption, but we've used the combined capacity of net metering, distributed energy and actual demand response as a percentage of the utility's peak demand.
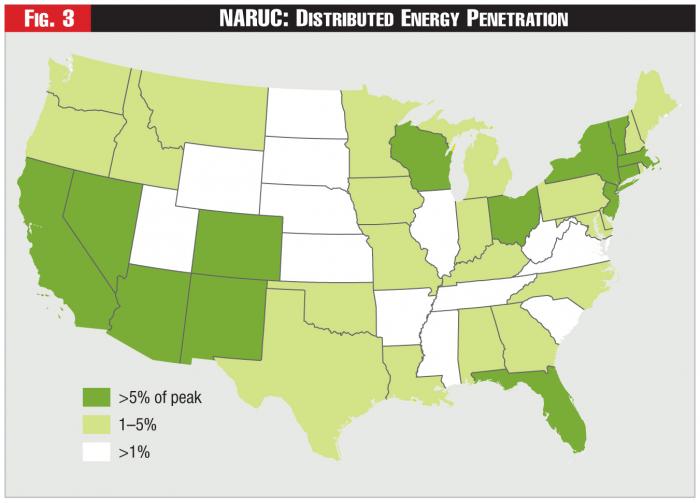 Figure 3 - NARUC: Distributed Energy Penetration
To more closely reflect the day-to-day operating characteristics of the grid, we've used the lower number of the summer or winter system peak for each utility.
Overall, there are one hundred twenty-four large regulated utilities in the country with annual revenue over two hundred fifty million dollars. These regulated entities account for fifty-seven percent of the nation's retail sales of electricity.
Another one hundred twelve large public power, cooperatives and retail providers account for nineteen percent of the market. Over four thousand small utilities and power providers comprise the remaining twenty-four percent.
Of these large regulated entities, twenty-three utilities in fourteen states have distributed energy resources where the total capacity is greater than five percent of the system peak. Another forty utilities in twenty-two states have resources that represent from one to five percent of the peak.
The states themselves can be organized by size. In the accompanying diagram, we've separated them into four classes, based on total retail revenue in the states.
As noted, the fourteen states with the highest DER adoption levels represent forty percent of the total market for electricity. Four of those states have annual revenues of more than fifteen billion dollars, or about forty million dollars each day.
It is clear that, moving forward, much more granular information will be required in order to effectively and wisely plan for investments that support distributed energy resources adoption.
As the manual notes, "To better identify locations for development of DER, a utility needs to understand the characteristics of its grid." It continues by noting that, "The threshold level of adoption for significant impacts may not vary only from state to state and utility to utility, but also from feeder to feeder or circuit to circuit inside one service territory."
These numbers suggest that, far from being an issue to grapple with in the distant future, the questions surrounding distributed energy are ones that regulators must grapple with today.
Over one million customers today are on net metering rates with rooftop solar. They represent over ten gigawatts of capacity nationwide. For the top regulated utilities represented in the accompanying table, the revenue value of the distributed energy resources capacity as a proportion of total revenue is nearly ten billion dollars annually.
Certainly, what we read in the headlines every day suggests that there are real issues to be addressed today, but the utility-specific numbers help explain why.
