A demographic analysis of plants in the U.S.
Robert McCullough is the Manager of McCullough Research, an energy research firm, which has performed extensive work in analyzing prices and markets in the electric utility and other energy industry sectors.
A recent article published in The New York Times examined the claim of the U.S. nuclear industry that the aging reactors of its domestic nuclear fleet would be able to continue operating to an age of 60 years.1 This claim seems an absurd assertion, since few technologies last 60 years. When the current generation of nuclear reactors was planned, eight-track tape players dominated music, computers occupied entire buildings, and the life expectancy of the average American male was 67 years.
The question of the life span of these resources is now highly pertinent, given efforts to subsidize nuclear units in New York and Illinois. Are these subsidies for five years or 30 years? Obviously, the expected lifetime of these units is going to have a central bearing on the debate.
There is little research on the life expectancy of the average commercial reactor. According to data published by the International Atomic Energy Agency (IAEA), the oldest operating nuclear reactor (Dottingen, Switzerland) is only 44 years old.2
The most common analysis of the life expectancy of nuclear reactors uses the "Grandfather's Hammer" model. In this model, it is assumed that when the head of the hammer ages, it will be replaced. When the handle ages, it is replaced. The logical conclusion drawn from the model is that the life expectancy of a hammer is effectively infinite.
While the model appears perfectly adequate for determining the life expectancy of hammers, it is a poor predictor for determining the lifecycle of machines with more complexity. For example, we long ago "decommissioned" our cathode ray tube televisions, our reel-to-reel tape recorders, and our stereo consoles, which were the same vintage as the average nuclear plant in the U.S., without attempting to keep them in service by replacing bits and pieces of those machines as they wore out.
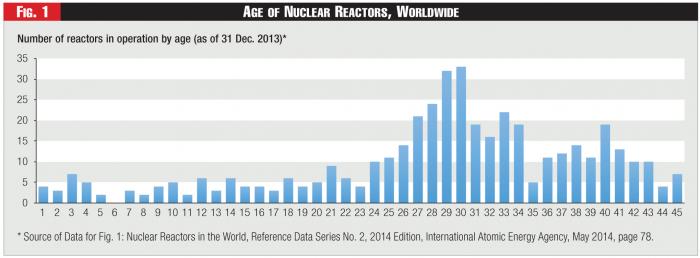 Figure 1 - Age of Nuclear Reactors, Worldwide
In fact, our 1960s-vintage TV never suffered a catastrophic failure. Instead, it faced several stages of technological obsolescence: e.g., its capability was limited to antenna reception, and its screen was too small. Repairs became difficult as more reliable, solid-state components replaced tubes. Finally, flat screens replaced the entire technology. The "Grandfather's Hammer" model simply was not applicable.
A global review of the life expectancy of commercial nuclear power plants shows a similar pattern. Although catastrophic failures have occurred - Chernobyl and Fukushima are the prime examples - the number of units decommissioned by major failures is small.
And catastrophic accidents are relatively rare. Such accidents are measured by the IAEA's International Nuclear and Radiological Event Scale (INES), as depicted here in Figure 2. Note, for example, that Chernobyl (1986) and Fukushima (2011) are the only category 7 events. Three Mile Island (1979) was a Category 5, as was the lesser known Windscale Pile (1957).3
Of the 150 nuclear reactors that have been decommissioned, the vast majority have simply reached the end of their economic or technological lifespan. The most recent IAEA annual reference on nuclear power gives the following reasons why reactors have closed in the past:4
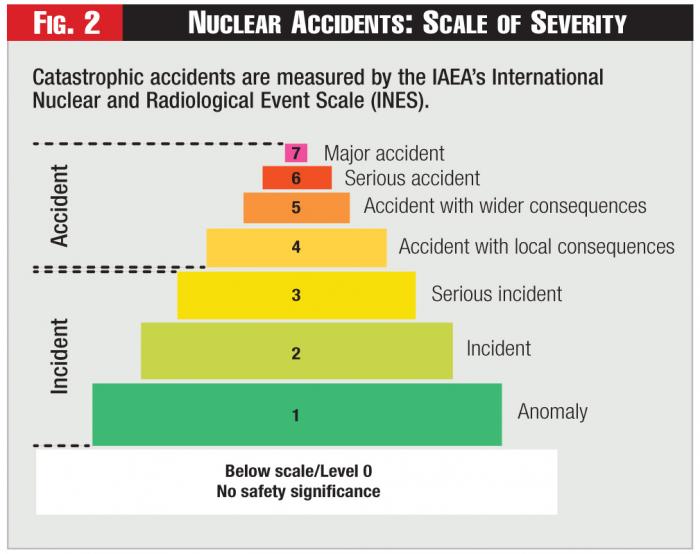 Figure 2 - Nuclear Accidents: Scale of Severity
• Economic Infeasibility. For example, five reactors started decommissioning in 2013. All but one closed because proposed repairs and upgrades became economically infeasible. The remaining closure, Kewaunee, exemplifies what will likely be a new trend in the industry. Kewaunee, a so-called merchant plant, closed because it could not compete with the low marginal cost of natural gas and renewable units in its area.
• Politics. Today, Japan, Germany and France are reducing their dependence on nuclear power. While the political realities of each of these countries and their nuclear industries are very different, it is unavoidable that at least some of the reactors within their borders are to be closed permanently, on the basis of policy discussions currently underway.

The industry has no established methodology to determine the remaining lifetime of a given nuclear plant still in operation. In most policy decisions, the assumption is that the existing Nuclear Regulatory Commission (NRC) license constitutes a prediction of the expected lifetime. While it is true that nuclear plants in the U.S. cannot operate without a NRC license, the fact of owning a license does not guarantee operability. Most nuclear reactors that have permanently shut down have done so before their licenses expired.
Given the complexity of the average nuclear station and the multiplicity of designs and technologies, a detailed forecast of life expectancy on a case-by-case basis is difficult. It is easy, however, to approach the question from the total population of reactors and then work back to specific estimates. In fact, this is exactly the approach undertaken in life expectancy estimates in demographics. The primary determinant of life expectancy is the survival rate for a specific cohort.
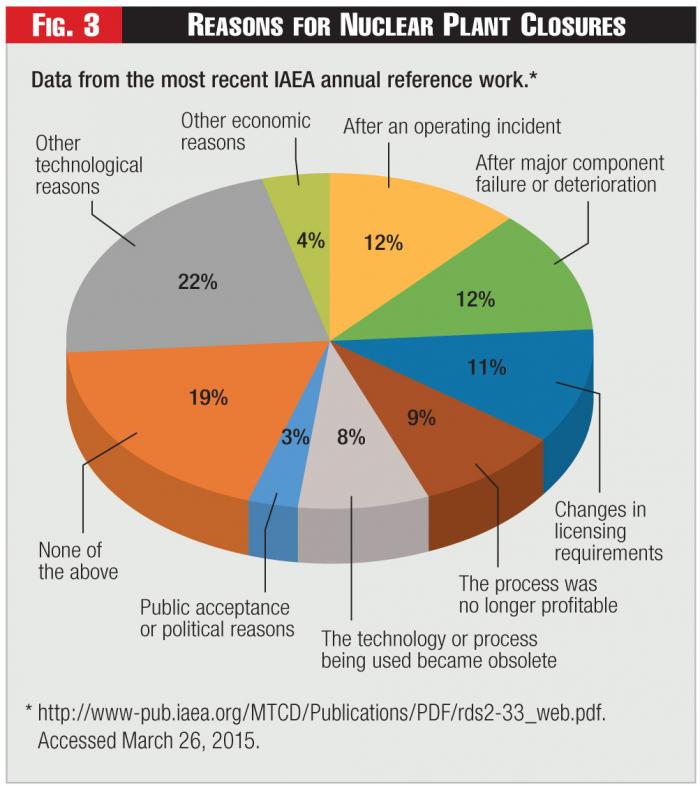 Figure 3 - Reasons for Nuclear Plant Closures
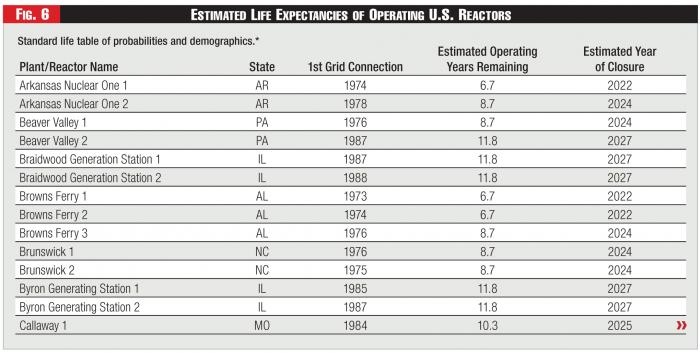
The basic data for Figures 4-6 in this article was taken from Tables 14 through 17 of the IAEA's annual reference work on the world's nuclear reactors.5
Turning to Figure 5, showing a Standard Life Table from demographic analysis for the word's nuclear reactors. Interpretation of the table is roughly the same as similar tables in demographics, i.e., the chance of mortality increases gradually with age. The cumulative survival rate is the product of survival rates for the current cohort and earlier cohorts. Thus for the 36-40 year cohort, approximately 40% of all reactors have closed. (Ed. Determined roughly by adding all of the entries in Figure 5 in the column labeled "Probability of Retirement between ages x and x+n", for all cohorts beginning with 0 years and ending with 36-40.) The pessimistic survival rate in the 46-50 cohort reflects the fact that no nuclear plants have stayed in operation for 50 years. Obviously, this cohort represents a very small sample, so an estimated value has been used for the 46-50, 51-55, and 56-60 cohorts.
Turning then to Figure 6, we can see that the life expectancy of the Diablo Canyon Power Plant Unit 2 (San Luis Obispo County, CA) which is 29 years old today, is approximately another twelve years, whereas the life expectancy of the R.E. Ginna Power Station Unit 1 (Ontario, NY), which is 45 years old in 2015, is less than five years.
The policy implications are very straightforward. Subsidizing a plant near the end of its probable lifespan is a doubtful investment. With the advance in natural gas technology and the falling prices of renewables, nuclear plants have been applying for subsidies across the United States. If subsidies are required, they need to be prioritized for the plants most likely to continue operating and providing benefits in the long-term.
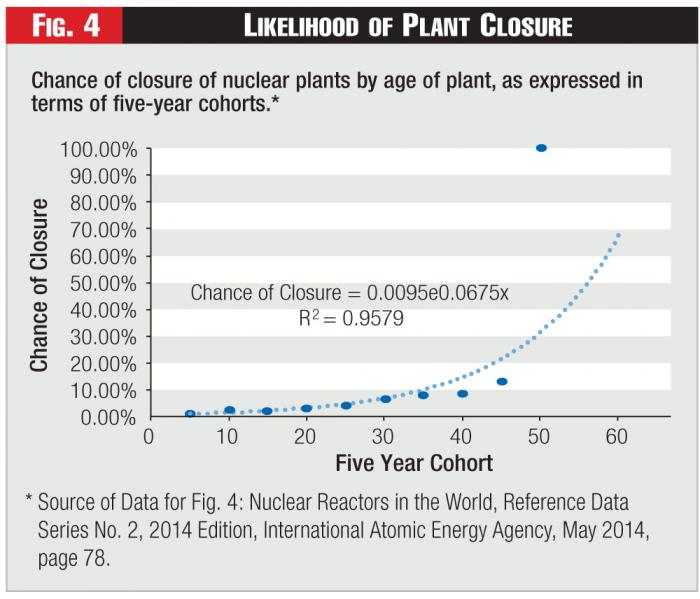 Figure 4 - Likelihood of Plant Closure
Endnotes:
1. Wald, Matthew. "E.P.A. Wrestles With Role of Nuclear Plants in Carbon Emission Rules, The New York Times, December 25, 2014, P. B3.
http://www.nytimes.com. Accessed March 26, 2015.
2. http://www.iaea.org/PRIS/WorldStatistics/OperationalByAge.aspx. Accessed March 26, 2015.
3. Windscale Pile was not a commercial nuclear reactor.
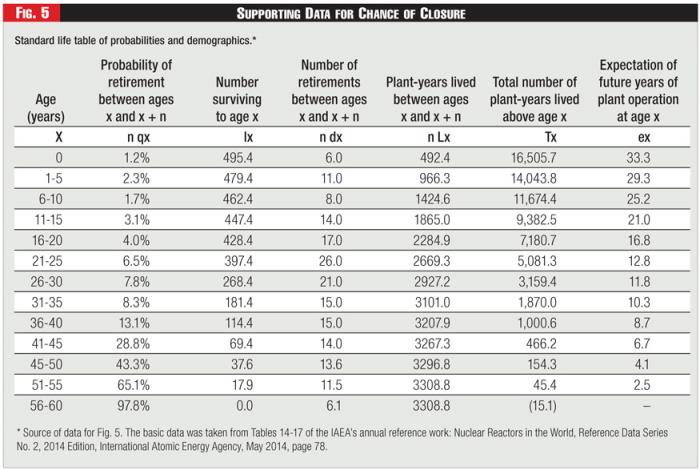 Figure 5 - Supporting Data for Chance of Closure
4. http://www.-pub.iaea.org/MTCD/Publications/PDF/rds2-33_web.pdf. Accessed March 26, 2015.
5. Nuclear Reactors in the World, Reference Data Series No. 2, 2014 Edition, International Atomic Energy Agency, May 2014, pages 31-56.
Lead image © Can Stock Photo Inc. / urcis