
Part I – Economy-wide Trends
Daniel Klein is president of Twenty-First Strategies, with forty years of experience in energy, environmental, and economic analy-sis. After many years as a senior vice president and director of ICF Resources Inc., he founded Twenty-First Strategies in 1995 to offer energy and environmental consulting services to energy companies, government agencies, and others. His work in recent years has focused primarily on climate change, energy security, strategic planning for electric power, sustainability, energy supply and usage, and related policies and strategies. Mr. Klein earned a Bachelor’s degree from the Massachusetts Institute of Technology and an MBA from the Stanford Graduate School of Business.
In the March 2016 "Monthly Energy Review," the U.S. Energy Information Administration has published its first 2015 full-year estimates of carbon dioxide emissions nationally. The trends are stunning, unthinkable even ten years ago.

For decades, emissions showed near-unbroken annual increases. Emissions were driven by population growth, income growth, and the underlying energy use.
See Figure 1.
This growth reached its peak in the middle of the last decade, topping out at six billion tons per year. But a confluence of factors has since led to lower carbon dioxide emissions, despite higher population and gross domestic product, GDP.
EIA's carbon dioxide estimates for 2015 have fallen to 5,270 million metric tons. This is down twelve percent or 723 million metric tons from 2005, near its all-time peak.
 Kaya Identity
These reductions are not only unprecedented in the U.S. They are far larger than any other country has achieved.
In fact, the U.S. carbon dioxide reductions are comparable to the total of all reductions from every country that has reduced emissions. Because of data lags, 2012 is the most recent year for international data on emissions. These data show that U.S. emissions declined by over 700 million metric tons from 2005 - 2012.
See Figure 2.
No other country showed carbon dioxide reductions of as much as 100 million metric tons. Collectively, the reductions from all 72 countries other than the U.S. amounts to 687 million metric tons. This is less than the U.S. alone.
 Figure 1 - U.S. Carbon Dioxide Emissions, 1950–2015 (MMT CO2)
The reduction in U.S. emissions is clearly substantial. To many, it may also be surprising. In a time when further emission reductions are called for, both in the U.S. and worldwide, a deeper investigation into the progress by the U.S. is merited.

Part I of this analysis looks at the economy-wide trends in carbon dioxide emissions. Part II, in next month's issue of Public Utilities Fortnightly, focuses more closely on the trends within the electric power sector, where most of these reductions have occurred.
Kaya Identity
Carbon dioxide emissions are the end result of a series of activities. For an overall economy, emissions can be calculated from the level of economic activity, the energy consumed in that activity, and the carbon content of that energy.
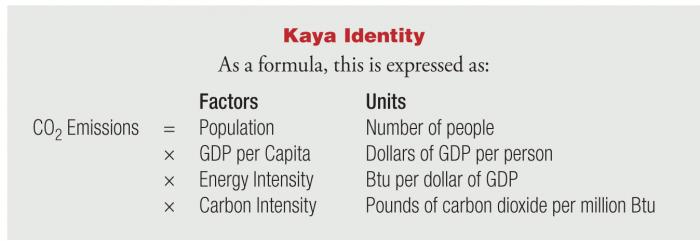
A well-known expression of these relationships is found in the "Kaya Identity," first proposed by Professor Yoichi Kaya in 1990. The Kaya Identity posits that total carbon dioxide emissions are the product of four factors: (i) population, (ii) GDP per capita, (iii) energy intensity, and (iv) the carbon intensity of energy supply.
 Figure 2 - Reductions in CO2 Emissions by Country, 2005–2012
As a formula, this is expressed as shown in the sidebar below.
The Kaya Identity is a useful tool in understanding which factors have the biggest impact on emissions over time. In any given year, changes in each of the Kaya components can drive emissions higher or lower. In the United States, population and GDP tend to increase over time, while energy and carbon efficiency tend to improve as a result of technological progress. The net change in emissions reflects the combined effect of these factors.
Figure 3 charts the effects of the different Kaya Identity components on U.S. energy-related emissions since 2005.
Bar chart segments that are positive represent factors increasing emissions from 2005. Segments below zero represent reductions. The black line shows the net effect of these ups and downs.
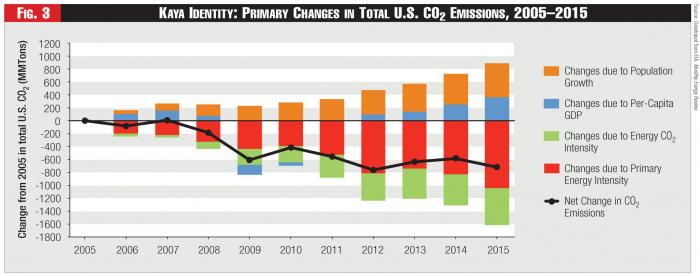 Figure 3 - Kaya Identity: Primary Changes in Total U.S. CO2 Emissions, 2005–2015
By itself, steady population growth of roughly one percent per year since 2005 would tend to increase emissions. Similarly, per-capita GDP growth, rising except for the recession years, is an upward factor on emissions. On the other hand, energy intensity tends to improve over time and thereby reduce emissions, while carbon intensity can go up or down.
For decades, growth in population and income accounted for most of the U.S. growth in carbon dioxide emissions. These upward pressures outweighed the reductions from improving energy intensity and carbon intensity, resulting in generally increasing emissions. But sharp improvements in both energy intensity and the carbon intensity of our energy mix have more than offset these upward pressures since 2005. As a result, total emissions are now falling.
Emission Reductions by Sector
The Kaya Identity points to improving energy intensity and the carbon intensity as key factors underlying the decline in U.S. carbon dioxide emissions since 2005. But these factors are broad economy-wide metrics. In order to deepen our understanding, it is useful to organize the data on a sector-by-sector basis.
Much of the nation's energy data, including energy consumption and carbon dioxide emissions, is presented across four broad sectors: residential, commercial, industrial, and transportation. Included in each sector is primary energy consumption by fuel, as well as the primary energy consumption for that sector's electricity consumption. For our purposes, we wish to separate out the electricity into its own sector, leaving the other four sectors to account for non-electric energy use, mainly petroleum fuels, natural gas, and coal.
 Figure 4 - U.S. Energy-Related CO2 Emissions by Sector, 1973–2015 (MM Metric Tons CO2)
Figure 4 charts the energy-related emissions by sector over the years 1973 - 2015.
With the exception of the industrial sector, which significantly reduced energy use and emissions following the 1970's oil shocks, emissions were generally increasing, reaching a peak of about six billion metric tons around the years 2005 - 2007. Since then, emissions have declined by unprecedented amounts, as noted above.
Figure 5 focuses on this recent decline in greater detail, looking at sector-by-sector carbon dioxide changes since 2005. Reductions are seen in all sectors, but the reductions in the electric power sector comprise over half of all reductions. In 2015, these reductions amounted to 491 million metric tons, a twenty percent decline from 2005. The electric power sector reductions alone represent an eight percent decline in total U.S. emissions from 2005.
Transportation reductions of carbon dioxide emissions are also substantial. This mainly reflects improvements in average miles per gallon, reductions in vehicle-miles traveled per dollar of GDP, and greater biofuel use in the fuel mix.
 Figure 5 - Changes in U.S. Energy-related CO2 Emissions by Sector
Industrial emissions also declined sharply as a result of the great recession. But emissions have rebounded slowly as sector activity has gradually recovered.
For the residential and commercial sectors, where most of the energy use is in the form of electricity, emission changes from direct fuel consumption are less substantial.
For the electric power sector, the driving forces behind this unprecedented emissions decline will be examined in Part 2.
Lead image © Can Stock Photo Inc. / arquiplay77
