Monthly Summary Report: Jan. 2018
Steve Mitnick is Editor-in-Chief of Public Utilities Fortnightly and author of the book “Lines Down: How We Pay, Use, Value Grid Electricity Amid the Storm.”
Electric Bills Now 1.33% of Expenditures

Six of the Eight Lowest Months in History Have Been This Year
In November, 1.33 percent of consumer expenditures – 1 of every 75 dollars – paid electric bills. The remaining 98.67 percent – 74 of every 75 dollars – was available to the American consumer to purchase other goods and services. According to the latest Commerce Department data.
November’s 1.33 percent was tied for the seventh lowest month in history, going all the way back to January 1959. The lowest month in history was earlier this year. Actually, this was a tie too.
Just 1.24 percent of consumer expenditures in January and in February – 1 of every 81 dollars – paid electric bills. The remaining 98.76 percent – 80 of every 81 dollars – was available to the American consumer to purchase other goods and services. The next lowest month in history was also earlier this year.
 Figure 1 - Electric Bills Now 1.33% of Expenditures
Just 1.26 percent of consumer expenditures in August – 1 of every 79 dollars – paid electric bills. The remaining 98.74 percent – 78 of every 79 dollars – was available to the American consumer to purchase other goods and services.
Indeed, six of the eight lowest months in history have been this year, 2017.
The U.S. Department of Commerce calculates the Gross Domestic Product. Since consumer expenditures are around seventy percent of the GDP, the Commerce Department tracks consumer expenditures in extraordinary detail.
These percentages are easy to understand. 2% means that one-fiftieth of consumer expenditures goes to pay electric bills. 1% means that one-hundredth of consumer expenditures goes to pay electric bills.
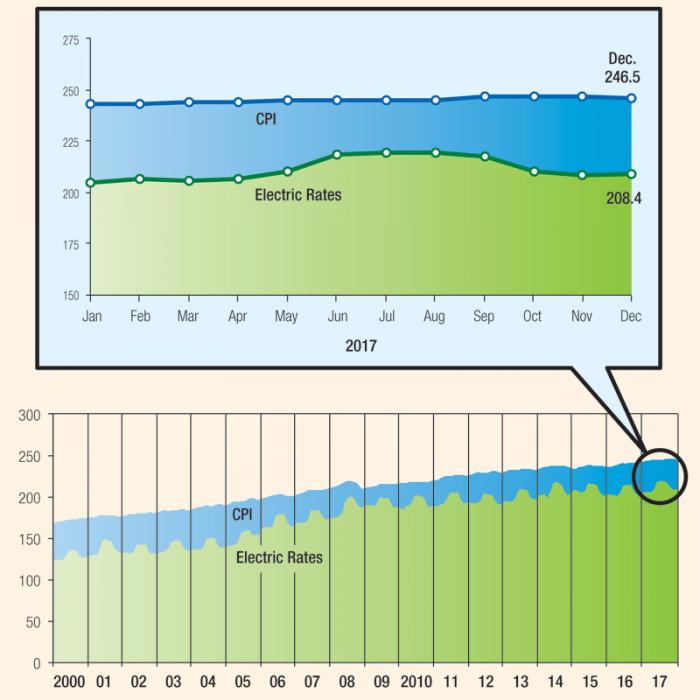 Figure 2 - Electricity Lags CPI Increases
The lower these percentages are, the smaller is electricity’s share of consumers’ budgets. And the larger is the share of consumers’ budgets for all other goods and services.
So, the lower these percentages are, the less costly electricity has become. And the wealthier that consumers have become.
Source: Bureau of Economic Analysis, U.S. Department of Commerce. Public Utilities Fortnightly maintains a comprehensive historical and updated data base of consumer expenditures, and our own analyses of the data. Fifty-eight years of monthly data.
Electricity Lags CPI Increases
Electric Rates vs. Consumer Price Index
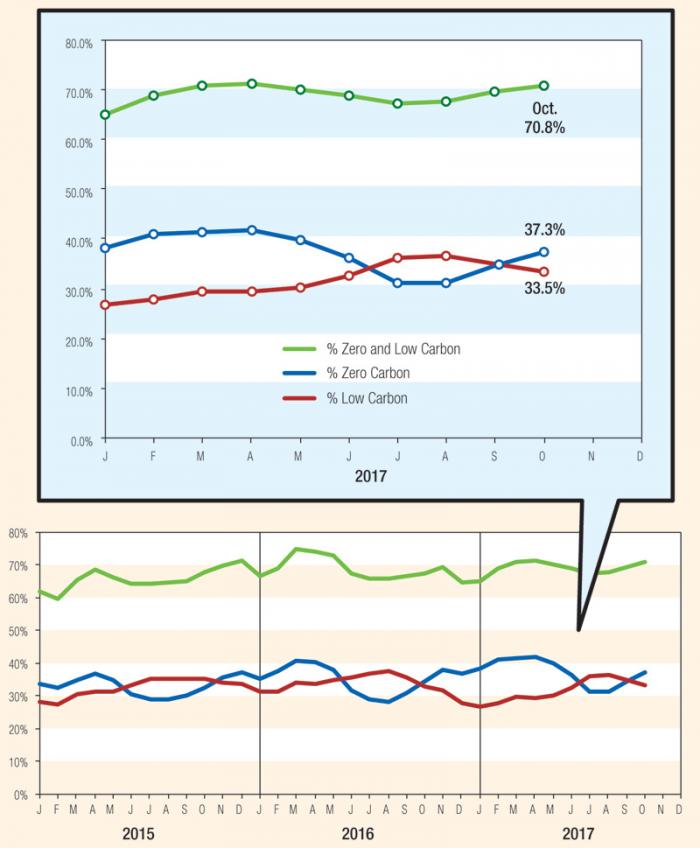 Figure 3 - Zero and Low Carbon Around 70% Grid Generation
">
Figure 3 - Zero and Low Carbon Around 70% Grid Generation
">
The Labor Department recently reported November’s Consumer Price Index, the CPI. The detail – which we closely follow – shows the trends in prices for everything from pork chops to postage to pet services. Including the electric rates that consumers pay.
">In December, the CPI was 2.1 percent higher than it was a year earlier, in December 2016. And electric rates on average were 2.6 percent higher than they were a year earlier. So, inflation-adjusted, electric rates slightly increased over the last twelve months.
">Over the last twenty-four months, the CPI was 4.2 percent higher than in December 2015. Electric rates on average were just 3.3 percent higher. Over the last thirty-six months, the CPI was 5.0 percent higher than in December 2014. Electric rates on average were just 2.0 percent higher. So, inflation-adjusted, electric rates decreased significantly over the last twenty-four months and the last thirty-six months.
Long-term, electric rates have risen only 84.5 percent as much as the CPI.
To track the average price of the goods and service that American consumers buy, the U.S. Department of Labor calculates the Consumer Price Index.
There’s a CPI for all the goods and services that consumers buy. And there’s a CPI for categories of goods and services, including residential electric rates.
Compare the CPI for electric rates with the CPI for all goods and services. Doing so shows if electric rates are increasing faster or slower than the price of other things. And, therefore, it shows if electricity is becoming costlier or less costly to consumers.
In the long term, 100% means the CPI for electric rates and the CPI for all goods and services increased at the same pace since the Labor Department’s base period (the years 1982 through 1984). At 100%, electric rates aren’t becoming costlier, and they aren’t becoming less costly.
The lower that these percentages are, the slower the CPI for electric rates has risen as compared to the CPI for all goods and services. So, the lower these percentages are, the less costly electricity has become.
Source: Bureau of Labor Statistics, U.S. Department of Labor. Public Utilities Fortnightly maintains a comprehensive historical and updated data base of the CPI for electric rates, the CPI for all goods and services, and our own analyses of these indices. Sixty-five years of monthly U.S. data. Forty years of monthly regional data.
Zero and Low Carbon Around 70% Grid Generation
October Had Seventh Highest Zero and Low Carbon Historically
In October 2017, the latest month of data published by the Energy Department, zero carbon generation was 37.3 percent of grid generation and low carbon was another 33.5 percent. Summing the two, 70.8 percent of grid generation was zero and low carbon. This was the seventh highest month historically in terms of clean power production. The record remains March 2016 when 75.1 percent was clean power production.
In those months when clean power production exceeds 70 percent, high carbon falls to below 30% of grid generation. One could project that in a month not too distant in the future, high carbon will fall to below 20 percent of grid generation. Below a fifth of the grid’s power.
The U.S. Department of Energy tracks in extraordinary detail the origin of the grid’s electricity. Each month, it publishes total electric generation and the breakdown by manufacturing method.
Some of these methods emit carbon dioxide. Coal, natural gas, other gases, petroleum. Some don’t. Net. Geothermal, hydro, nuclear, solar, waste, wind, wood.
This Scorecard adds the amount of the grid’s electricity produced by the zero-carbon methods, and by low-carbon methods (natural gas). And then calculates their share of all grid electricity.
These percentages are easy to understand. 25.0% would mean that a quarter of the grid’s electricity is zero-carbon. The U.S. grid hit and surpassed 40.0% zero-carbon for the first time in March 2016. At 40.0%, four of every ten kilowatt-hours produced by the grid didn’t emit carbon dioxide.
">">">">">">">">">">
