
Designing markets to accommodate variable resources.
Michael Hogan is a senior advisor for the Regulatory Assistance Project. Bentham Paulos serves as project manager for the America’s Power Plan project. http://www.americaspowerplan.org/
Customer demand for new energy technologies is hitting a brick wall of regulatory systems designed for the last century. This is especially true in the design of power markets.

Renewables and demand-side technologies have some features that will disrupt traditional energy markets as they grow. As a package, they present a very different way of running the grid, with greater efficiency, energy security, and lower emissions. But market designs need to evolve to accommodate innovation and clean energy.
Meet The Duck
The rapid growth of solar power is causing regulators in California to plan for change.
A typical daily demand curve in California rises in the morning as people wake and go to work, it peaks in the afternoon as air conditioners kick in, and it hits a second, highest peak in the early evening, as workers come home to their dinner and TV.
Solar, of course, produces power with the movement of the sun, peaking in the afternoon, and falling toward sunset. A growing solar supply will take an increasingly large bite out of the afternoon power demand, but have a lesser effect on that early evening peak. The California grid operator has projected the “net demand” – the amount of power demand remaining to be met by non-solar sources – through 2020, and came up with a shape that was instantly dubbed The Duck.1 Picture a demand curve, with its head in the early evening. The more solar grows, the bigger the duck’s belly gets. (See Figure 1).
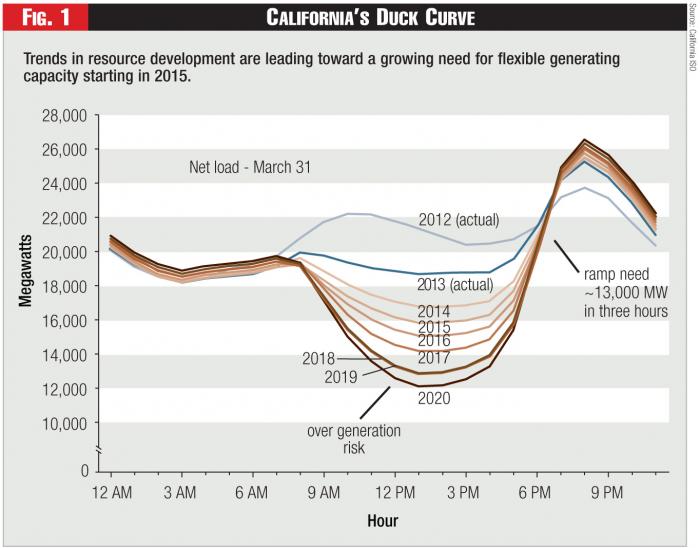 Figure 1 - California’s Duck Curve
The duck-shaped evolution of the net demand curve will have a few implications for grid operations. First, the rising net demand in the afternoon will be bigger than it is now, increasing the need for fast-acting generators or demand-side measures, like demand response and energy efficiency. While some see this as a major problem, others aren’t so sure. One participant at a meeting of California regulators remarked, “I could take the head off that duck. Just give me some demand response.”
Markets need to do a better job of shifting value to more flexible resources capable of responding efficiently to these changing conditions. Energy efficiency programs focused on the elements of that evening peak could permanently bring down the head. Dynamic pricing – e.g., power prices that reflect actual real-time market conditions – can provide incentives for consumers (or for innovative companies providing services to consumers) to reduce and shift the demand. Energy storage can be charged up in the middle of the day and deployed in the evening hours. Solar panels can even be pointed more westerly, toward the setting sun.
Winds of Change
While The Duck describes what can happen in a typical day due to solar power, wind power is already causing disruptive impacts in some places.
Denmark is one of those places, with 30 percent of its total electricity from the wind in 2012 and a goal of 50 percent by 2020.2
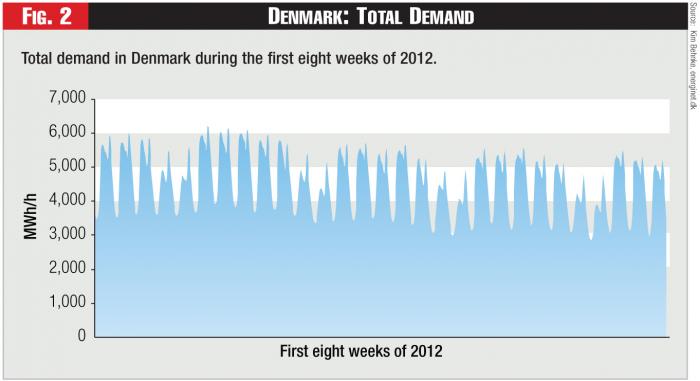 Figure 2 - Denmark: Total Demand
The increased need for flexibility is illustrated in a particularly vivid manner in the figures below, showing data from Energinet, the Danish grid operator. The top graph shows a total (gross) demand curve for January and February. The second graph subtracts wind power to show the net demand remaining to be met.
Wind power during these windy winter months at times produced more than the total demand – peaking at 111 percent on February 25. Changes in wind output caused ramps that were much larger than ramps in the gross demand, though not more abrupt.
The remaining local generation came from coal plants (53 percent) and CHP (20 percent). While the CHP systems did some load following with their power output, they were needed to provide heat for district heating installations, so were considered must-run plants. Dispatchable coal power plants ramped up and down in response to the wind power output, but never cycled off completely, since they can’t easily be brought back online and in many cases they also serve heat loads.
Instead, it made the most sense to use the greater Scandinavian and German grid for an optimized dispatch. The third graph shows the total remaining demand after subtracting all local production – in other words, net imports and exports with neighbors. Denmark shares power with other Nordic countries, especially with Norwegian hydropower, which it tracks in real time.3 (See Figures 2, 3, and 4).
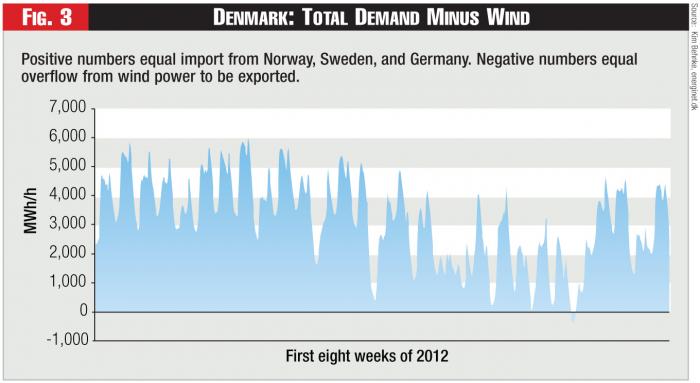 Figure 3 - Denmark: Total Demand Minus Wind
This Danish case study provides a number of lessons for integrating renewables. First, it is obviously possible, since it’s being done today with high reliability. Second, the flexibility needed can come in many forms, from dispatchable power to larger balancing areas. There is very little energy storage or demand response in the Danish system; these will help in the future as Denmark approaches its 50 percent wind goal.

It also shows the need for a different way of thinking about power supply and a different way of paying for it.
In a power system with traditional dispatchable generators, demand is met by a mix of so-called baseload, mid-merit, and peaker plants. But in the Danish example, there’s little room for an always-on baseload plant, since cheaper wind power forces it out of the way and operationally more flexible plants are more useful to the system. While “baseload” is used by some as a synonym for “dependable,” an inflexible baseload plant could be more of a liability than an asset in an increasingly renewable future.
What’s needed instead are flexible resources that can match the ups and downs of both demand and wind power output, and meet the net demand. These can be fast-acting mid-merit and peaking plants, but also demand-side technologies like demand response and storage. There are even experiments underway to use excess electricity to make other products, like synthetic fertilizer.4
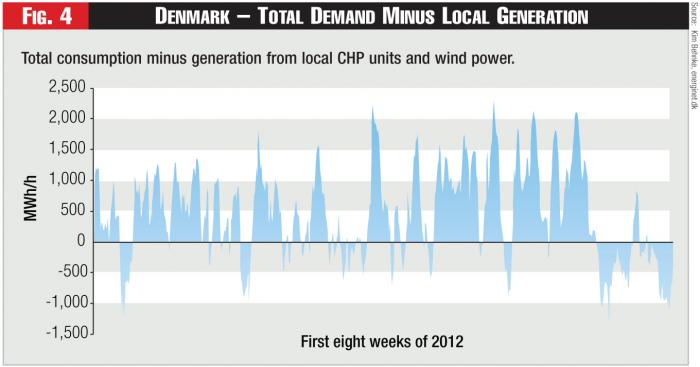 Figure 4 - Denmark – Total Demand Minus Local Generation
The Hawaiian island of Kauai5 is another laboratory for this kind of future. Hawaii is almost completely dependent on imported oil for all of its energy. With retail power rates in excess of 40 cents per kWh, customers on Kauai are eager to go solar, installing 1,500 systems in the past two years and helping move toward an official goal of 50 percent renewables in 10 years. With solar its most unlimited and scalable resource, the utility is thinking of “offering rates to encourage customers to use electricity during the day, when power is being produced more cheaply,” such as for charging electric cars. This way they can use solar to displace oil in both transportation and power production.
Small Balancing Areas
While Hawaii has unique issues as an island state, it isn’t the only island in the U.S. power system.
As utilities in some regions evolve from self-supporting monopolies to competitive players, their operating areas are being merged to promote competition and lower the cost of operations. It’s cheaper to consolidate balancing areas and share resources than to operate as an island. This is especially true with renewables, which introduce more variability into the system.
But parochial market interests in other regions have been getting in the way. Xcel Energy executive Judy Poferl described6 in 2011 how the company was dealing with wind power. At the time, Xcel had about 3,000 MW of wind spread across its three operating systems. The northern system had over 1,200 MW but is in MISO, an integrated regional system with a footprint of 116,000 MW. The southern system had 650 MW but is in SPP, with a pool of 46,000 MW.
In these big regional markets integration is simple, just a ripple in a big pond. But in Colorado, with no regional market and limited cooperation between neighboring utilities, Xcel was dealing with 1,200 MW of wind in a system of only 7,900 MW. When the wind is high and demand is low, Xcel’s Colorado system has gotten as much as 55.6 percent7 of its power from wind.
And Xcel isn’t done with wind. The company recently announced a 50-percent boost in wind capacity8 across its three regions.
Small operating regions drive up costs and reduce reliability. Denmark, as part of a greater regional grid, regularly exceeds 100 percent of national demand with wind power with no problems. The easiest solution for Xcel would be to share operations with its neighbors. Some utilities in the West are beginning to move toward a solution, adopting an “energy imbalance market,” which makes it easier and cheaper to balance the system but stops short of a competitive power market.
Matching Money to Need
Huge amounts of wind and solar will transform market dynamics. They can turn the typical perception of power costs on its head, reshaping demand and prices.
The key need now is flexibility. Markets have been designed to pay for energy and, in some cases, capacity, but current designs are not as good at paying for the services that will valuable for integrating renewables.
America’s Power Plan describes a number of options for aligning power markets with technological growth.9 Market designs will have to evolve to provide the proper incentives for flexibility. We need to make markets larger and faster, treat demand-side options the same as supply-side, open the market to more participants, and buy the services needed to run the grid in a more renewable future. This can include paying for fast-ramping services; creating more accurate price signals that mean more money for resources that are flexible and fast-acting and less money for those that aren’t; and allowing demand response to bid into energy, services, and capacity markets.
Once we match the way money flows in the markets more accurately to the needs of the system, the move toward a clean energy future will be much smoother, cheaper, and more secure.
Endnotes:
1. The widely circulated “duck curve” in actuality represents a “shoulder period” day and is therefore, over the near term, a somewhat extreme case, however it amply illustrates the fundamental issue.
2. http://cleantechnica.com/2013/02/01/wind-energy-hits-over-30-of-denmarks-electricity-consumption-at-end-of-2012/
3. http://www.energinet.dk/Flash/Forside/UK/index.html
4. http://www.agmrc.org/renewable_energy/ethanol/using-the-wind-to-fertilize-corn
5. http://website.kiuc.coop/content/official-kiuc-press-releases
6. http://www.midwesterngovernors.org/Transmission/2011/Poferl.pdf
7. http://www.denverpost.com/breakingnews/ci_19342896
8. http://thinkprogress.org/climate/2013/08/24/2520551/upper-midwest-windfarm/
