
Big data at work – from plant performance to customer interaction.
Ramesh (“Rudy”) Shankar is a research professor at the Energy Production Infrastructure Center, at the University of North Carolina Charlotte. Formerly he was an executive with the Tennessee Valley Authority.
It wasn’t long ago that engineers monitoring power plants to maintain operations within a specified range (neither exceeding nor dropping below alarm levels) would analyze only the unit’s “historian” – that being the component that stores the equipment data, typically representing the temperature, pressure or flow, as captured at given intervals. Violating these limits for certain critical components raises concerns. They could lead to an unscheduled plant outage, or even worse effects on the safety of plant personnel.

Unfortunately, however, the plant historian was rarely prognostic in its behavior. More often it was too late: alerting operators only after limits were exceeded, thus leading to breakdowns. And while such failures fortunately are rare, their occurrence can lead to extensive damage, loss of life, and sometimes a huge setback to industry. Some notable accidents include the TVA Gallatin rotor burst in 1974, which resulted in fatalities and turbine missile destroying the building; the penstock failure at the Swiss Bieudron 1,200 MW hydroelectric plant in 2000, crippling the generator and causing widespread crop damage; Eskom’s Duvha plant turbine failure in 2003, after it was returned to service after a malfunction; and the total destruction of the Sayano-Shushenskaya Dam, a 6,800 MW capacity plant in Russia, in 2009, caused by increased vibrations in a turbine that caused the entire casing cover to be blown off.
These events could have been caught early with modern techniques, perhaps preventing any destructive impact by giving time to plant engineers to react. The answer lies in a technique known as “correlation processing.”
Simply put, correlation searches for dependence between data. The stronger the correlation – as measured between ± 1 (perfect correlation) and zero (no correlation) – the stronger the dependence and hence the stronger the predictive capabilities of the data, relative to each other. If one goes up, the other strongly correlated partner goes up (or down). If one data stream is sick, the other’s will (or won’t) be mimicked. However, if process conditions have changed, say, with the plant now operating in a flexible mode and generating less than its rated power, the correlated pair will fall or rise together, depending on the correlation being positive or negative. The trick for the plant operator is simply this: does the sickness indicator occur early enough to provide actionable intelligence?
But this tool has now only raised deeper questions. For example, if the measure is high, is the relationship a statistical freak or causative? Can behavior of one be used to predict the other, with a mother lode of data mining now discovered? Yet the chances are very slim that engineers would think this way. Rather, they likely are content knowing that if highly correlated for the given set of observations, these data streams can then be used with caution to infer behavior. Yes, demand for electricity is driven by weather, but not (or perhaps maybe?) by electricity rates as well.
Early Commercial Applications
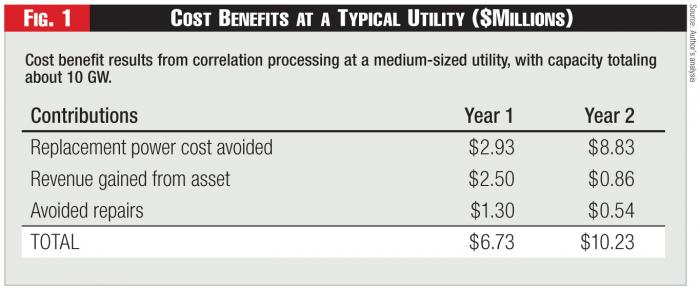 Figure 1 - Cost Benefits at a Typical Utility ($Millions)
Correlation processing might’ve had a significant role in ending the Cold War. During that time, the danger to either superpower was the ability of the other to launch seaborne and undetectable attacks on the other and so retain the element of surprise. Yet the U.S. had an ace up its sleeve. It had set up miles-long twin fixtures in the Pacific and Atlantic Ocean called the SOSUS arrays that could reliably detect enemy submarines transiting from several thousand miles. The correlation among the sensors in the array could distinguish background noise from the sounds emanating from the submarines and detect nuanced information including maneuvers, speed of approach, etc. This number crunching required powerful computers usually sequestered in air-conditioned spaces several hundred miles away on-shore. The results were processed leisurely, since the enemy targets were several thousand miles away and their intentions now revealed clearly.
Commercial application of correlation processing received a big boost in the 1990s under the sponsorship of the U.S. Department of Energy through an algorithm called MSET, backed with some fancy statistical footwork with a strong underpinning in hypothesis testing. In an application for equipment monitoring at a nuclear plant, it was demonstrated how historian-acquired data could be processed from several components and the power of correlation and statistical measures used to confirm the presence of anomalies. Engineers could look at so-called closed-loop systems whose system behaviors were heavily interrelated. For example, in a thermal power plant, the fuel consumption, water flow in the boiler, and the turbine power and their myriad subsystems are closely related. And so the signals from their parameters also should be well correlated.
The first commercial application was demonstrated by the airline industry. The goal was to discover engine problems during flight operations to prompt speedy maintenance. In the late 1990s, Southwest and Delta airlines commissioned a vendor to provide in-flight detection of engine problems of the airline fleet. The software analyzed a machine’s operating history and used algorithms to describe normal activity under varying load and operating conditions. Using data generated from equipment sensors, the software created a model that captured the relationships among the sensors. It then analyzed all the sensor data in real time, 24/7 – correlating the new data with the historical model, and highlighting and focusing attention on only those readings that were irregular compared to similar conditions.
Correlation technology thus seemed to be primed for a power industry troubled by high operations and maintenance (O&M) costs, owing to aging assets, more stringent regulations, and what turned out to be a decade of flat growth. Utilities approached this opportunity gingerly, however, unsure of how it could be adopted, let alone show a positive return on investment (ROI).
Fleet-Wide Monitoring
Over the last decade the author has worked with utilities in evaluating vendor technology, developing specifications for utilities, organizing utility interest groups world-wide to leverage correlation technology to improve reliability and broaden knowledge management of equipment failure mechanisms and lessons learned. Instrument calibration of safety related systems was the first target application. Safety channel instrumentation measures critical temperature pressure and flow parameters during a refueling cycle. This procedure is repeated for the several redundant channels required on nuclear plants. This task is usually onerous, exposing personnel to radiation. It can be minimized if it can be assured that all channels are functioning normally throughout the fuel cycle, with continuous monitoring. This change in procedures was approved by the regulatory authority based on tests performed at several nuclear plants. It was evident to the utilities that a bigger prize awaited in developing fleet-wide monitoring and incipient damage detection capabilities for their large fossil fleets, given that expertise was diffused (turbine experts are unlikely to be found at every operating plant, for example), and that plants remained prone to failure, due to a variety of factors related to the aging of assets and their required operational flexibility.
Implementation and experience with fleet-wide monitoring in the U.S. is fairly extensive. The author was engaged in many of the early developments and led efforts to increase utility knowledge and participation in these activities. The scope and objectives varied as did the schedule. Many wanted to develop these capabilities to improve plant operations enterprise-wide, regardless of geographic boundaries. Many others focused on equipment reliability and relied on correlation processing for equipment diagnostics to detect incipient failures. Still others looked to this technology for guidance on plant startup and shutdown to maintain uniform and consistent methodologies for combustion turbine fleets. The attractive feature was the ability to operate a virtual center for excellence with experts being able to view the same information via the internet and arrive at consensus decisions on the state of the component under examination.
Early utility adopters drew on the power of correlation processing and the potential for then-emerging wireless sensors to perform on-demand monitoring of problem components. Many relied on industry consortia like EPRI to provide guidance.
In the beginning the centers raised suspicion among plant staff that this was an attempt to look over their shoulders and assess personnel performance. Some utilities applied change management procedures to address this very compelling HR issue so as not to risk losing out on this attractive technology.
Utilities with FWM centers are concentrated on the East Coast, where most of the generating assets are based. As of the time of writing more than 200 GW capacity – 20 percent of the total U.S. capacity – were utilizing correlation processing at their centers.
While the cost benefits and focus of applications might vary from company to company, all utilities reported immediate benefits from the first year of operation. Success at each utility was critical for buy-in at an executive level. Any hiccups in executive acceptance could thwart the best laid business case. So it was important to adopt a conservative and well-documented business case and be very open with failure scenarios. Implementation was sometimes staggered: first a pilot application among few plants, then across the fleet (though not necessarily all the plants). Even in this scenario, the more successful implementations followed a very aggressive schedule – one or two plants per month.
Compared to the U.S. experience, international implementation has been much more top-down driven; buy-in from the top executive ranks was essential. But the U.S. lead was unmistakable. The technologies used and lessons learned at U.S. utilities were eagerly lapped up. Penetration is more prevalent in Europe and South America, mainly due to large holdings by EdF and Iberdrola in these respective continents, but India, China, Japan, and South Korea have made large inroads in implementation.
Some notable successes of correlation processing – i.e., catching equipment and process problems earlier than otherwise possible – have included detection of abnormal vibrations in a generator rotor at a large U.S. utility, which led to the discovery of a 360-degree crack along the shaft. If left unaddressed, the damage could have been extensive. Other successful catches included detecting overheating of main transformer coolant; primary air fan damage preventing complete combustion in a fossil plant; and sticky flow measurement nozzles causing the plant to be run at less than optimum power. Correlation processing revealed these problems, although they could’ve been identified by alert operations.
A typical cost-benefit analysis from a medium-sized utility (> 10,000 MW capacity) is shown in Figure 1. Given the low initial roll out price (average cost: $1 million per 5 GW capacity), the ROI is fairly rapid. More importantly, the increased reliability, confidence in resource planning, and avoidance of potential loss of revenue provide broad financial justification.
Invariably all the utilities were able to justify their operation within the first year. The larger utilities benefited from larger and perhaps more frequent catches. This was no doubt due to more observers looking at the same data. Yet surely it was due also to uniform and standard procedures brought to bear across the entire enterprise. It might be tempting to assume large utilities with more generating assets are likely to benefit more. However, the anecdotal information indicates that gains are uniformly high among different-sized utilities. There’s been no instance of any utility that has abandoned this technology after initiating it because cost benefits were lacking.
The most successful implementations have emphasized constant benchmarking and continuous improvement, plus heavy involvement and education of plant personnel.
Lessons Learned
Big data has generated a lot of interest in the press. Utilities dream of going behind the meter; integrating smart grid data and social media data in one collective heap to learn how better to influence customer behavior. That has brought forth new technologies to integrate information from disparate sources. Social media analytic apps have sprouted and are able to match what can be done with quantitative data. Nevertheless, utilities might do well to absorb the lessons learned from adopting correlation technology for their generating assets.
First and foremost, they must not overlook initial reactions. Deep staff suspicions saw this new technology as a ploy to displace workers or scrutinize their performance. In a customer-centric world the term “smart grid” itself conjures images of Big Brother utilities calling the shots. Indeed many large U.S. utilities were stymied early on when ratepayers chafed at this seeming arrogance and couldn’t understand what was in it for them.
Second, utilities must involve customers in deciding how big data should work and constantly obtain feedback from the community on the progress made in the implementation. Arguably the use of social media data has created much concern on invasion of privacy concerns, so utilities will be well advised to tread cautiously.
Third, any trumpeted success should be shared jointly between utilities and customer groups. Minimize utility benefits; emphasize instead how the customers can benefit from clean energy, less waste, increased energy efficiency and lower rates.
Fourth, utilities must plan out what areas of big data will have customer effects and tackle them accordingly. The schedule should be deliberate, allowing for customer feedback to be incorporated in the planning. Utilities are well versed in how they trot out their integrated resource planning to their stakeholders and public. A similar disciplined approach for big data could be appropriate.
Fifth, utilities must prepare organizationally to ensure that big data implementation is carried out smoothly and the technology is robust. The most glaring deficit in most utility organizations is the silo relationship between IT and OT (operation technology). Very few utilities have recognized the need to have greater integration between IT and OT. What would this mean? There must be a customer-service relationship between OT and IT, and future IT planning should closely collaborate with OT planning.
Finally, the utility organization must take advantage of new technologies that can detect incipient equipment problems by frequent interactions with other parts of the organization like supply chain, maintenance, and customer services, to fine tune and calibrate their functions. For example, the supply chain could be alerted by frequent failures of certain vendor components to negotiate better terms and conditions or justify finding a new vendor.
