
Seeking a rate design that recovers costs fairly from customers with rooftop solar.
Mark Lively provides consulting services for pricing of electricity and natural gas, through his firm, Utility Economic Engineers. Reach him at MbeLively@aol.com. Lori Cifuentes is Manager of Load Research and Forecasting for Tampa Electric Co. Reach her at llcifuentes@tecoenergy.com.
In the U.S., most residential customers of electric utilities are on a consolidated tariff that collects revenue based on a fixed monthly fee (often called a customer charge) and a commodities charge (an energy or kWh charge). The fixed monthly fee is generally designed to recover metering and billing expenses. The commodities charge is designed to recover expenses associated with the supply of both energy (kWh) and demand (peak kW).

For electricity, fuel costs are a large component of the energy expense. Fixed costs related to the infrastructure investment to provide central station service to the customer are a large component of the demand expense. However, there is often disagreement about whether some of the traditionally classified energy costs should be reclassified as demand and vice versa.
The growth of rooftop solar is dramatically reducing the amount of energy that goes through residential utility meters from the utility to the customer. Indeed rooftop solar often reverses the flow, such that many rooftop solar residential customers deliver energy to the local wires company during some periods of the day. In Washington, D.C., the mayor has a vision to reduce energy consumption by 50% and to have 50% of the remaining energy produced by rooftop solar.
Under conventional ratemaking, PEPCo, the D.C. utility, would need to increase its commodity charge by a factor of four (4.0) to overcome such a reduction in energy sales. The rationale for this assertion is that PEPCo's revenue needs would be unchanged to pay for the wires it will still own, wires that will still provide service to the customer, while the commodity through the wires would be reduced to 25% of the level which was used to set the current commodity rate level. The result would be non-generating residential customers paying high rates (and higher bills) in order to subsidize the lower bills paid by residential customers who decide to install rooftop solar.
A Demand Charge as Remedy
A remedy to this "death spiral" rate outcome is the introduction of a demand charge for all residential consumers. Even customers who wish to reduce their carbon footprint with rooftop solar still will need to receive some electricity from the utility grid from central station generating units. Some of that electricity will be for periods when the sun is not shining (i.e., at night) or is low in the sky in the early morning or evening. Some of that central station electricity will also be needed to meet customer load in excess of the capacity for the solar rooftop unit's capacity to meet that load. Of course, if the rooftop solar unit is damaged or out for maintenance, power will be needed from the grid as a standby resource to backup the output. Implementation of a demand charge will reduce the subsidies that standard residential customers would otherwise pay to support the installation of rooftop solar.
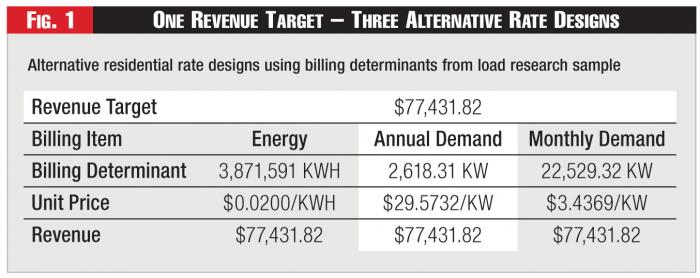 Figure 1 - One Revenue Target – Three Alternative Rate Designs
With respect to design of a demand charge, there are a myriad of options available. One might have the residential customer specify the amount of standby power desired. Utilities have historically used such specifications by larger, more sophisticated, commercial and industrial customers to set a contract capacity. A slightly different concept is the measured demand charge, where the customer's metered maximum power consumption is used in place of a contract capacity or perhaps in conjunction with the contract capacity. The great expansion in the installation of Advanced Meter Infrastructure (AMI) by electric utilities in recent years can provide metered demand data for residential customers, demand data that were not previously available when the most ubiquitous residential meter was a mechanical energy meter.
Figure 1 presents three rate designs for collecting revenue from a group of residential customers. The data are from a utility's actual load research sample of almost 274 residential customers. The revenue target was set at $0.02/KWH for the energy taken by these customers. The annual demand is the sum over this group of customers of each customer's maximum hourly demand during the year. The monthly demand is the sum over this group of customers of the sum over the year of the customer's monthly maximum hourly demand each month.
Each unit price is the revenue target divided by the relevant billing determinant. Since the revenue target was set at $0.02/KWH, the unit energy price is precisely $0.0200/KWH. When the billing quantity is annual demand, the unit price is $29.5732/KW. An alternative billing quantity is monthly demand, which is the sum of the twelve individual monthly demands. The monthly demand billing quantity is about 8 times the annual demand billing quantity - 8 times because not every monthly demand is equal to the annual demand. Indeed, most are about 2/3 of the annual demand. The unit price for the monthly demand would be $3.4269/KW, which is about 1/8 of the unit price for the annual demand billing quantity. In all cases the product of the unit price and the billing determinant results in revenue equal to the revenue target.

The uniformity of the amount of revenue collected under these three rate designs is consistent with the way utilities are regulated. Prices are set such that the revenue under a particular rate design will produce the revenue target. The utility would nominally be indifferent under the three rate designs were it not for the fear of a decline over time of total revenue, the "death spiral" mentioned above.
 Figure 2 - Potential Subsidies for Solar Owners
The utility providing the load research data also has an active rooftop solar program, with 344 customers. The customers effectively have the same AMI information as is provided for the load research meters, plus information on the energy occasionally delivered by such customers to the utility. The billing determinants for these rooftop solar customers can demonstrate the size of the subsidies such customers are receiving from standard residential customers, as is developed in Figure 2.
The unit prices in Figure 2 are copied from Figure 1, where they had been calculated. The billing determinants in Figure 2 are for the utility's delivery to the residential rooftop solar customers.
Incidentally, the rooftop solar customers have an average annual consumption per customer of only 13,169 KWH versus the 14,130 KWH used on average by the load research customers, about 7% less. This difference, and more, is due to the lower load factors of the rooftop solar customers. As discussed later, the average size of the customers in the rooftop solar group, as measured by annual demand, is slightly larger than the average size in the load research group, again when annual demand is used as the metric. When monthly demand is used as the metric, the two groups are within 0.1% of each other's average size.
The revenue under the alternative rate designs in Figure 2 is the simple multiplication of the unit rates times the relevant billing determinant. The current subsidy for this group of rooftop solar customers is relative to all customers being charged on a pure energy rate. Thus, a cost allocation plan using annual demand would have increased the revenue from these rooftop solar customers by $15,288.29 or 17% relative to the pure energy rate used by most electric utilities in the U.S. A cost allocation plan using monthly demand would have increased the revenue from these rooftop solar customers by $6,709.98 or 7% relative to the pure energy rate used by most electric utilities in the U.S.
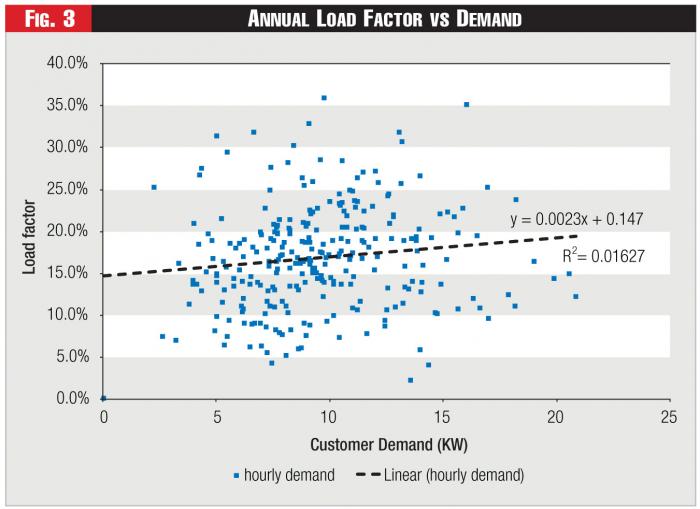 Figure 3 - Annual Load Factor vs Demand
The revenue increase in Figure 2 for rooftop solar customers would be offset by a decline in the revenue from all other residential customers. The utility's total revenue would be unchanged, as was demonstrated in Figure 1. So long as rooftop solar is a small portion of the utility's retail class, the effect on the other residential customers would be small. The effect on the other residential customers will grow with the growth of the size of the rooftop solar market.
The subsidies occur because utilities incur fixed infrastructure costs to serve their customers based on the capacity they must build to be ready to provide service at any time while most current residential rates are designed using only a commodities charge. This historical design paradigm arose from two factors. First, prior to AMI, there was a substantial difference in cost between energy only meters and demand billing meters. Energy meters, being substantially lower in cost to install and read, were utilized for residential consumers whereas more costly demand billing meters could be justified for larger sized commercial and industrial customers. Second, historically utilities assumed that residential customers had similar load factors (actual energy consumption as a percentage of potential energy consumption under the monthly peak demand) and thus would make a demand rate versus an energy rate to be equivalent in collecting revenue from any group of residential customers. Variation in load factor for commercial and industrial consumers, as well as the ability to absorb the higher cost of demand metering versus their typical bill, justified application of demand billing for those customers.
Who's Subsidizing Who?
Figure 3 shows the distribution of load factors for the residential load research customers, where the load factor is calculated as the average energy used during the year divided by the peak demand during the year, expressed as a percentage. The regression line indicates that load factor is almost random relative to the size of the residential customer in the load research sample.
Figure 4 adds data from rooftop solar customers. The added regression line (solid black line) indicates that the load factor for this group of customers is also almost random relative to the size of the residential customer with rooftop solar. The more significant feature of the regression line is that the rooftop solar customers have a lower load factor than do the customers in the load research sample, a zero intercept at 10.85% versus 14.70%. The 3.85% differential slowly closes as the size of the residential customer gets larger, but again, the degree of closure is not significant.
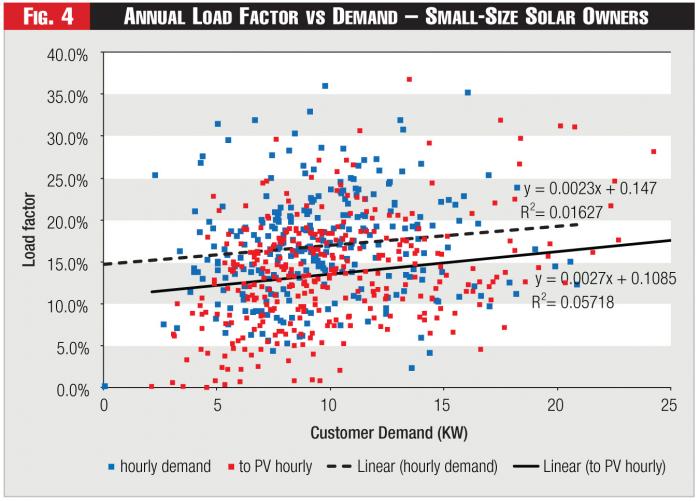 Figure 4 - Annual Load Factor vs Demand – Small-Size Solar Owners
Figure 5 presents the same data as Figure 4 except that range of the plot is allowed to show rooftop solar customers of all sizes, instead of being limited to the range of smaller-sized customers that is plotted in Figure 3. This indicates a seeming size bias in those customers who have opted for rooftop solar. There are some very large rooftop solar customers, customers of a size not sampled in the load research program. An implication is that the subsidies identified in Figure 2 are often going to very large residential customers at the expense of smaller residential customers.
Figure 6 provides a distribution by size of the single family homes in the two groups, the residential load research group and the rooftop solar group. The bars for the few customers shown on the right side of Figure 5 barely show up on Figure 6. There are proportionately more customers in the load research sample size of 10-15 KW then there are rooftop solar customers, and more rooftop solar customers in the 5-10 KW range than there are load research customers. Thus, the seeming bias suggested by comparing Figures 3 and 4 is not significant.
The data used in Figures 1 and 2 and presented in Figures 3, 4, and 5 are for all residential customers, including mobile homes and multifamily homes. Restricting the analysis to single family homes demonstrates the actual subsidy is likely to be much higher than the 17% and 7% shown in Figure 2, rising to 24% and 13%. The average annual peak demand for the load research sample is 9.56 KW versus 10.41 KW for the rooftop solar customers. This is the reverse of the size comparison on an average usage basis. For the monthly peaks, the comparison is 82.22 KW versus 82.31 KW. Again, the monthly peaks are the sum of twelve monthly peaks while the annual peak is the single annual peak for each customer.
The Demand Charge Solution
Rooftop solar residential customers who receive net metered service from their local utility on an energy basis are being subsidized by non-generating residential customers. The subsidies arise because their utility incurs fixed costs for customers based on the demand they impose on the network, whether just for that utility's distribution function or for the bundled functions of generation, transmission, and distribution for a utility that remains vertically integrated.
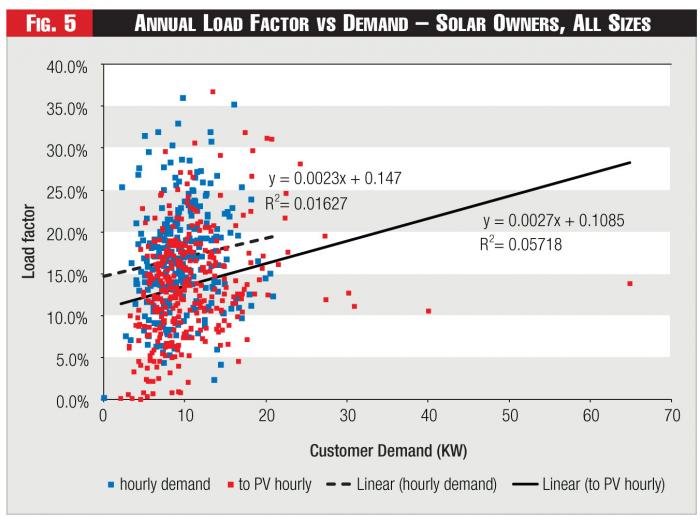 Figure 5 - Annual Load Factor vs Demand – Solar Owners, All Sizes
Utility load research data can be used to estimate the size of that subsidy by constructing test demand rates for this class of customers, test demand rates that recover the same revenue requirement as the current commodity rates recover. Applying these alternative test demand rates to billing determinants for rooftop solar residential customers is expected to produced increased revenue from such groups of customers by a range of 7% to 17% depending upon the choice of billing demands, monthly versus annual. The individual impacts will depend on customer load factors and the energy production factors of the rooftop solar units.
Applying such alternative demand rates for all residential customers would be an alternative to charging a special fee only to rooftop solar customers, reducing the charges of bias that have been leveled against some utilities for imposing such special fees. This demand rate solution would continue the standard approach of using a single rate design construct for all residential customers and address any charges of unduly discriminatory pricing for customers with rooftop solar.
Image © Can Stock Photo Inc. / rtbilder
