
Part Two
Roger Bezdek is the president of MISI, in Washington, D.C. He has served as a senior advisor in the office of the Secretary of the Treasury and as research director at the Department of Energy. He is the author of six books and over three hundred publications in scientific and technical journals, including over a dozen articles in Public Utilities Fortnightly.
The U.S. Department of Energy provided funding for the analysis of these data. However, the paper does not necessarily reflect Administration policy.
In Part One, we assessed the recent past and current state of the U.S. coal industry, with emphasis on Appalachia. In Part Two, we examine alternative scenario futures for the industry, involving assumptions about economic growth, energy requirements, technologies, tax incentives, and research and development.
Forecast Scenarios

Our firm, MISI, used a version of the U.S. Energy Information Administration's forecasting model, the National Energy Modeling System, to examine the potential impact on coal and coal-related jobs of various assumptions and scenarios. That version is labeled "NETL CTUS-NEMS."
This is an integrated model of the U.S. energy system linked to a macroeconomic model. The impacts on the coal industry and coal-related jobs through 2050 of the following scenarios were assessed.
Reference Case: AEO 17 No Clean Power Plan (CPP) side case. EIA's 2017 Annual Energy Outlook forecast that assumed that the Clean Power Plan would not be enacted.
Scenario Two: High Economic Growth Case. Assumes 2.6 percent average annual GDP growth, 2 percent per year increase in electricity demand, and lower enhanced oil recovery operating and maintenance (O&M) costs.
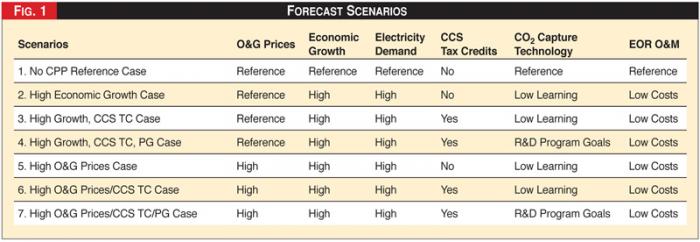 Figure 1 - Forecast Scenarios
Scenario Three: High Growth, CCS (Carbon Capture and Storage) TC (tax credits) Case. Scenario Two with carbon capture and storage tax credits of thirty-five dollars per ton of carbon dioxide for enhanced oil recovery (EOR) and fifty dollars per ton of carbon dioxide for geologic storage.
Scenario Four: High Growth, CCS TC, PG Case. This is Scenario Three with DOE CCS R&D program goals (PG) achieved: a thirty percent reduction in CCS costs by 2030.
Scenario Five: High O&G Prices Case. Scenario Two with natural gas prices that escalate from 3.30 dollars in 2015 to 10.50 dollars/million British Thermal Units (2016 dollars) in 2050.
Scenario Six: High O&G Prices/CCS TC Case. Scenario Five plus CCS tax credits.
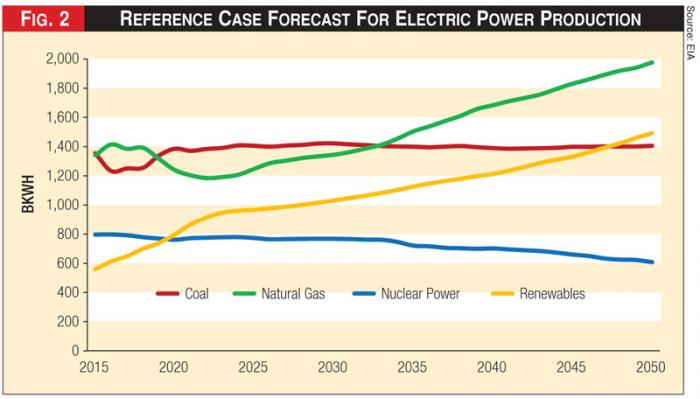 Figure 2 - Reference Case Forecast For Electric Power Production
Scenario Seven: High O&G Prices/CCS TC/PG Case. Scenario Six with DOE CCS R&D program goals achieved.
These scenarios are summarized in Figure 1.
Note: The Trump Administration seeks a growth rate of 3 percent, or higher, for the U.S. economy. The Administration's FY 2018 budget request reflects this. The Trump Administration is also interested in the future of coal industry jobs.
The 2.6 percent average annual GDP growth corresponds to the AEO 2017 High Growth Case, whereas in the AEO 2017 no CPP Reference Case, the growth rate is 2.1 percent. It was not possible to use a growth rate higher than 2.6 percent in any scenario because the growth rate is exogenous to the NETL CTUS-NEMS model.
 Roger Bezdek: With the CCS tax credits, new coal plants with CCS will be built, but not coal plants without CCS.
High economic growth alone leads to higher natural gas prices than in the Reference Case.
Section 111(b) of the Clean Air Act, the Carbon Pollution Standard for New Power Plants, remains in place in all of the scenarios. With the CCS tax credits, new coal plants with CCS will be built, but not coal plants without CCS.
Without the DOE program goals, the rate of CCS technology learning is reduced from the AEO 2017 Reference Case because there is no federal CCS R&D. The O&M costs for EOR are assumed to be lower than in the Reference Case in all of the alternative scenarios. MISI estimated the economic impacts and jobs created annually 2020 - 2050 by coal mining, new coal plant construction, coal plant O&M, EOR, saline sequestration, and pipelines.
See Figure 1.
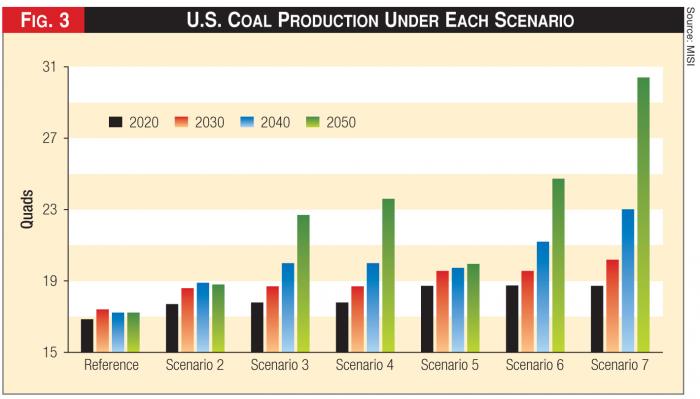 Figure 3 - U.S. Coal Production Under Each Scenario
The employment concept used is a full-time equivalent job in the U.S., which is defined as two thousand eighty hours worked annually, and adjusts for part time, seasonal employment and labor turnover.
MISI estimated the total number of direct plus indirect jobs: direct jobs are those created in the specific activity; indirect jobs are those created throughout the required interindustry supply chain and in supporting activities; total jobs are the sum of all the jobs created. Dollar estimates are in constant 2016 dollars.
The scenarios indicated the effects of different policies and assumptions on the coal industry and related sectors of the economy. For example: all the alternative scenarios indicated the impacts of a higher economic growth rate, compared to that used in the Reference Case. Scenario Two simulated the combined impact of higher economic growth and higher electricity demand growth.
Scenario Three indicated the marginal impacts of CCS tax credits. Scenario Four illustrated the marginal impacts of CCS tax credits combined with achievement of the DOE R&D program goals.
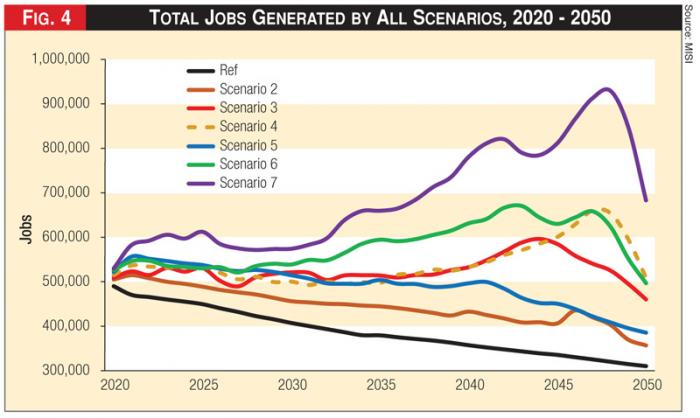 Figure 4 - Total Jobs Generated by All Scenarios, 2020 - 2050
Scenario Five showed the marginal impacts of higher oil and natural gas prices. Scenario Six indicated the marginal impacts of higher oil and natural gas prices combined with CCS tax credits. Scenario Seven showed the marginal impacts of higher oil and natural gas prices combined with CCS tax credits and achievement of the DOE R&D program goals.
Each scenario can be compared to the Reference Case or to another scenario to identify the marginal impacts of a specific policy or set of policies. For example, comparison of scenarios Five and Two indicates the marginal effects of higher oil and natural gas prices. Comparison of scenarios Six and Three shows the marginal effects of CCS tax credits with and without higher oil and natural gas prices.
Forecast Results
MISI simulated the impacts on the U.S. coal industry through 2050. The Reference Case projects no increase in coal use through 2050, as shown in Figure 2. In this case, due to increasing labor productivity and declining coal demand, coal-related jobs decrease continuously. However, the U.S. may require more coal than is currently anticipated for a variety of reasons. For example, EIA forecasts that through 2050 natural gas costs to utilities will increase much more rapidly than coal costs.
See Figure 2.
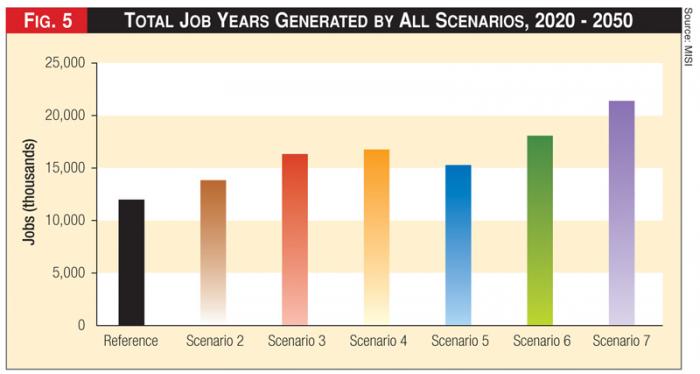 Figure 5 - Total Job Years Generated by All Scenarios, 2020 - 2050
Figure 3 indicates that the scenarios have dramatic effects on U.S. coal production and that the impacts increase as the forecast period lengthens.
See Figure 3.
Figure 4 shows the total number of jobs created annually (directly and indirectly) by each of the seven scenarios.
See Figure 4.
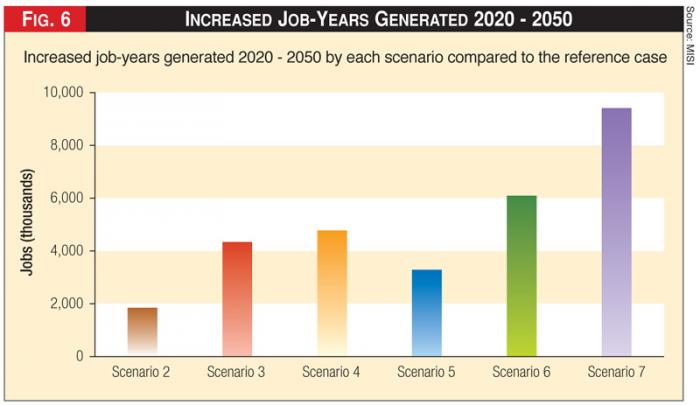 Figure 6 - Increased Job-Years Generated 2020 - 2050
Figure 5 shows the total job-years generated by the scenarios through 2050, and illustrates that all of the alternative scenarios generate substantially more job-years than the Reference Case.
See Figure 5.
Whereas under the Reference Case just under 12 million jobs are generated, Scenario Two generates 13.8 million jobs; Scenario Three generates 16.3 million jobs; Scenario Four generates 16.8 million jobs; Scenario Five generates 15.3 million jobs; Scenario Six generates 18.1 million jobs; Scenario Seven generates 21.4 million jobs.
Figure 6 shows the increased job-years generated by each scenario compared to the reference case. Specifically, compared to the reference case: Scenario Two generates 1.8 million more jobs, or fifteen percent more jobs; Scenario Three generates 4.3 million more jobs, or thirty-five percent more jobs; Scenario Four generates 4.8 million more jobs, or forty percent more jobs; Scenario Five generates 3.3 million more jobs, or twenty-eight percent more jobs; Scenario Six generates 6.1 million more jobs, or fifty-one percent more jobs; Scenario Seven generates 9.4 million more jobs, or eighty percent more jobs.
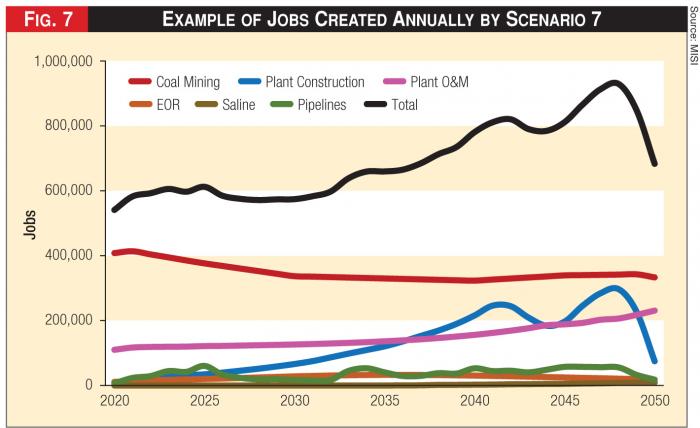 Figure 7 - Example of Jobs Created Annually by Scenario 7
See Figure 6.
The results indicate that under all the scenarios except Scenario Seven, the total number of jobs generated by the coal mining industry decreases continually through 2050. That is primarily due to continued increases in productivity in the industry.
Under each scenario significantly more jobs are generated by the coal mining industry through 2050 than under the Reference Case. In all of the scenarios, the coal mining industry generates the most jobs over the forecast period, both annually and in total.
In all of the scenarios, coal plant O&M generates the second largest number of jobs over the forecast period and, usually, annually as well (Figure 7). The numbers of jobs created by pipelines and EOR are relatively small in all of the scenarios.
Saline sequestration comprises the smallest portion of jobs created in any of the scenarios, and in several of them there is no saline sequestration. The sharp decline in jobs in the later years in Figures Three and Six is an artifact of the model's timeline for building new coal power plants and the associated construction jobs.
Several patterns of job generation are clear: under the Reference Case and Scenarios Two and Five, job creation generally declines over the entire forecast period. Under Scenarios Three, Four, and Six, annual jobs created tend to increase until the early to mid-2040s and then decrease significantly by 2050.
Under Scenario Three, job creation peaks in 2044; under Scenario Four, job creation peaks in 2047; under Scenario Six, job creation peaks in 2042 and again in 2047. Under Scenario Seven, significantly more jobs are created every year than under any of the other scenarios, and its peak year for job creation is 2048.
Scenario Seven is the only scenario than creates more jobs in 2050 than in 2020. All of the scenarios generate many more job-years than the Reference Case.
See Figure 7.
The results of the scenarios have implications for economic, energy, and job-creation policies. For example, higher economic growth will increase the demand for coal and coal-related jobs.
Over the forecast period, under Scenario Two, which assumes a higher GDP growth rate than the Reference Case, nine hundred thousand more jobs are generated by the coal mining industry and 1.8 million jobs in total are generated - an average of sixty thousand jobs per year.
Further, the six alternative scenarios assumed a GDP growth rate of 2.6 percent, compared to the Reference Case growth rate of 2.1 percent. The Administration seeks to attain 3 percent annual growth. Achieving a 3 percent growth rate instead of 2.6 percent would generate about 15 percent more jobs over the forecast period in each of the scenarios.
Comparing the jobs created by the different scenarios indicates the marginal impact of different assumptions and policy options. The marginal impacts of achieving the DOE R&D program goals are significant.
In the environment of moderate oil and gas prices and with CCS tax credits in place, we see the generation of about four hundred fifty thousand more jobs. In the environment of high oil and gas prices and with CCS tax credits in place, we see the generation of more than 3.32 million additional jobs.
The marginal impacts of the CCS tax credits are also significant. Compared to the Reference Case, we envision between 4.3 million and 6.1 million additional jobs, depending on the level of oil and natural gas prices. With moderate oil and gas prices, we envision the generation of about 2.5 million more jobs; with high oil and gas prices, the generation of about 2.8 million additional jobs.
Thus, the marginal impacts of achieving the DOE R&D program goals in conjunction with CCS tax credits are substantial. Compared to the Reference Case, between about five and ten million additional jobs are created, depending on the growth rate and the level of oil and natural gas prices.
In the environment of higher economic growth and moderate oil and gas prices, we calculate the generation of about three million more jobs. With 2.6 percent growth, and high oil and gas prices, we calculate the generation of more than six additional million jobs, and nearly ten million new jobs with 3 percent growth.
Policy Implications
A higher economic growth rate will substantially increase the demand for coal and coal power plants, and will significantly increase the number of coal-related jobs generated.
The Administration's goal of three percent GDP growth will further increase the number of jobs by as much as fifteen percent. That means more than 3.2 million additional jobs would be created, for a total of nearly 25 million coal-related jobs.
All of the scenarios would significantly increase the number of coal-related jobs generated every year above those created under the Reference Case. The largest job increases occur within the high oil and natural gas prices environment utilizing both CCS tax credits and DOE R&D.
Even in an environment of moderate oil and natural gas prices, utilizing both CCS tax credits and DOE R&D greatly increases the number of jobs created. Tax credits are not sufficient to maximize job creation; DOE R&D is required.
The full maximization of job creation is achieved using both CCS tax credits and DOE R&D within a high oil and natural gas prices environment. This results in the creation of an additional 9.4 million jobs, or three hundred fifteen thousand jobs annually.
Even with moderate oil and natural gas prices, job maximization occurs using both CCS tax credits and DOE R&D. This results in the creation of 5 million additional jobs - one hundred seventy thousand jobs annually.
The marginal impacts of the DOE program are substantial. With moderate oil and natural gas prices, the R&D program creates an additional five hundred thousand jobs; in a high oil and natural gas prices environment the program creates more than 3.3 million additional jobs. The program creates nearly 4 million jobs with three percent economic growth.
MISI also found that under Scenario Seven, in 2030, West Virginia would gain enough jobs to comprise about four to nine percent of state employment. This would mean the difference between recessionary conditions in the state and full-employment prosperity.
The salient finding is that to maximize economic benefits and job creation, both CCS tax credits and the DOE R&D program need to be implemented. This will help stimulate economic growth which will, in turn, create even more economic growth and jobs.
