
Implications for Rate Design
The authors are economists with The Brattle Group. The views in this paper are their own and not those of their employer. They are grateful for comments and discussions with Westar Energy and with their colleague, Ryan Hledik. Comments can be sent to Ahmad.Faruqui@Brattle.Com.
Rooftop photovoltaic (PV) systems have become increasingly popular with certain customer segments of the mass market. These systems lower electric bills for those who install them.

They are also reputed to provide societal benefits, notably by reducing customers’ contribution to peak system requirements. However, a closer examination comparing the load patterns of residential electricity customers who have installed rooftop PV systems with those who have not installed them shows a contrary finding.
In this article, we provide an empirical analysis of customer load shapes, using data for Westar Energy’s residential customers in Kansas.
Our findings concerning the differences in load shapes, such as PV versus non-PV residential customers, are important for resource planners to consider when forecasting future loads.
They are equally important for rate analysts to incorporate in rate design. A load shape for PV customers that is materially different from the status quo residential customer may be sufficient grounds to implement a separate rate class. Such a class, specifically designed for mass market PV customers, would have much lower energy consumption but virtually the same peak demand. Regulators would add a demand charge into the rates for such customers, implementing so-called three-part rates, to account for the additional system costs that are not recovered through the fixed or volumetric rate components.
Non-PV Residential Customers
 Walter Graf: A load shape for PV customers that is materially different from the status quo residential customer may be sufficient grounds to implement a separate rate class.
We begin by presenting load shapes for residential customers without PV. The data are obtained from a load research sample of one hundred eighty-eight customers maintained by the utility. These customers were selected by the utility to be representative of the residential class.
The data cover the time period from October 1, 2013 to September 30, 2014 and consist of hourly load observations. The average monthly energy consumption is 1,020 kilowatt-hours and the average monthly peak demand is 5.9 kilowatts.
Representative load shapes are shown in Figure One for summer and winter months. (Summer period is defined as June–September; winter period includes all other months.)
See Figure One.
PV Customer Load Shapes
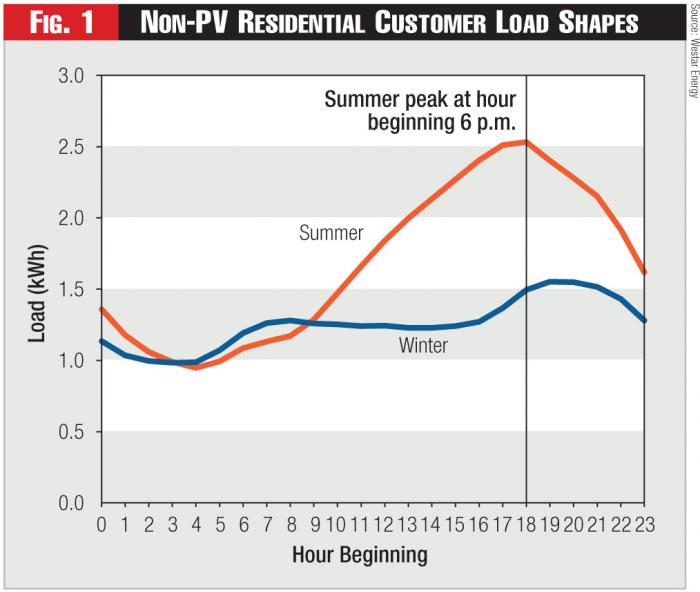 Figure 1 - Non-PV Residential Customer Load Shapes
The non-PV load shapes will be compared later in the article with those from a sample of two hundred sixty-six residential customers with rooftop PV systems. The sample spans the period from October 1, 2013 to February 5, 2017. The installation of PV systems by quarter is shown in Figure Two.
See Figure Two.
Our analysis reveals that, prior to the installation of PV systems, the average customer in this sample used 1,060 kilowatt-hours per month over the year and had a peak demand of 6.2 kilowatts. Both numbers are slightly higher than the corresponding values in the non-PV customer sample described earlier, reflecting a nominal difference across samples.
Methodology
The data sets from the two samples consist of observations of hundreds of customers over several months and years. But the samples are not balanced, as new customers are added over time.
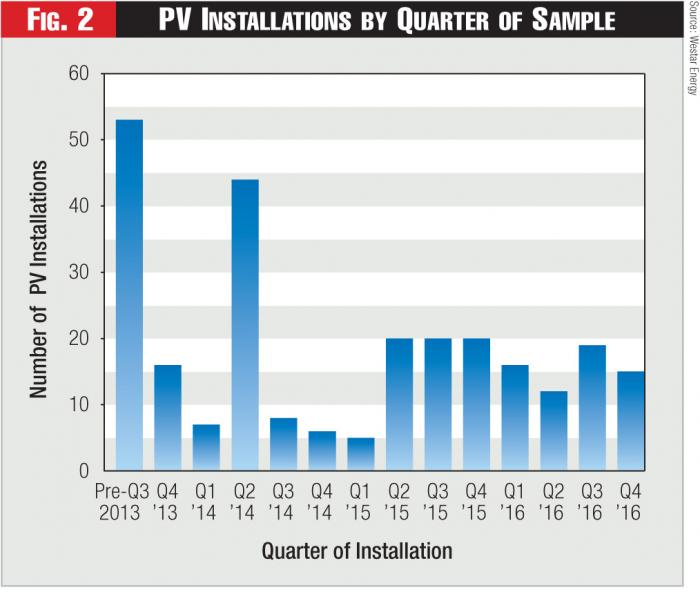 Figure 2 - PV Installations by Quarter of Sample
One approach is to choose a comparison window and compare average usage between the two samples in that window. However, this approach would reduce the sample size and does not fully account for pre-existing differences across samples.
Instead, we proceed with regression analysis to maximize the number of observations and control for any differences between the samples prior to the installation of PV.
The data sets have two primary dimensions: a time dimension, with a fifteen-minute resolution that we aggregated to hourly resolution, and a customer dimension.
We ran regressions with net load as the dependent variable and several explanatory variables. We describe them as pre- and post- distributed generation, or DG. Those included hour-of-day binary variables and interactions of those variables with a post-DG-installation binary variable, to estimate the effect of PV installation on customer net load in different hours.
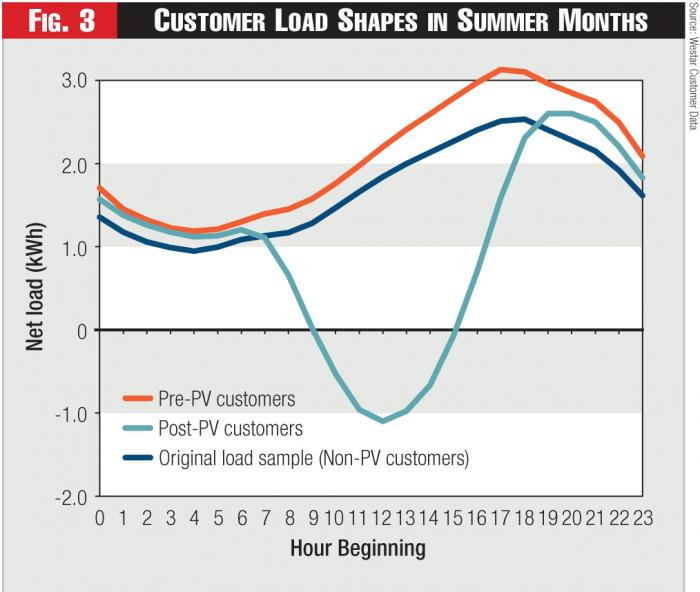 Figure 3 - Customer Load Shapes in Summer Months
We couldn’t include variables for all possible drivers of load. Some are unobserved or unobservable. That means such a regression would be prone to omitted variables bias, where the coefficients are estimated with bias due to correlations of the drivers of interest with the omitted variables.
To control for this possibility, we have included an econometric concept known as “fixed effects” in our regression. We define a fixed effect as a binary indicator variable (with values of zero or one) that is tied to one of the dimensions of the data. In our case, we used two-way fixed effects to match the two primary dimensions of the data, that is, time and customers.
Specifically, we used a fixed effect in the time dimension; it represented a separate binary variable for each hour. We also used a fixed effect in the customer dimension; it represented a separate binary variable for each individual customer.
This methodology controls for any and all omitted variables that vary across customers in a time-invariant way. For example, some customers are bigger than others; some customers are located in different geographic areas.
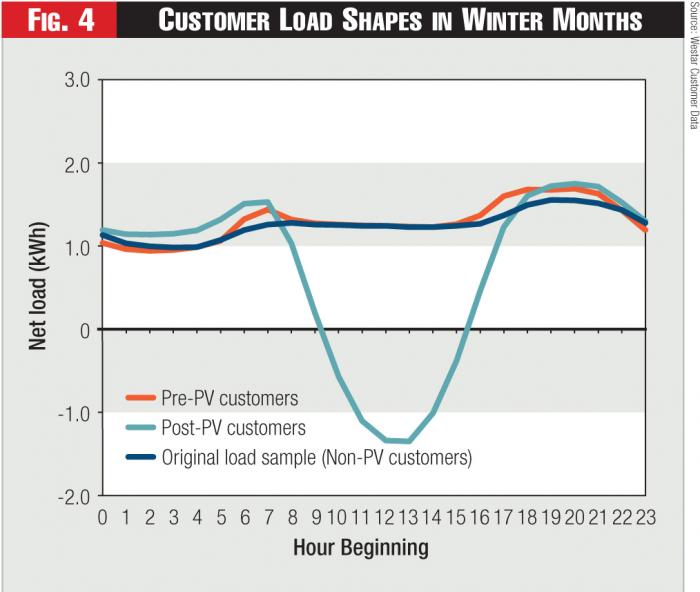 Figure 4 - Customer Load Shapes in Winter Months
The methodology also controls for any and all omitted variables that vary across time in a customer-invariant way. For example, some days are Sundays or Fridays or holidays, but those days will be the same for all customers.
By including these fixed effects, we have eliminated or controlled for many potentially confounding factors or omitted variables that could affect our analysis.
Separate regression models are run for PV customers and non-PV customers. The details can be provided on request.
Results
We find that, prior to PV installation, load shapes are similar between the two sets of customers, though PV customer loads are somewhat higher than those of non-PV customers. Here are the main findings:
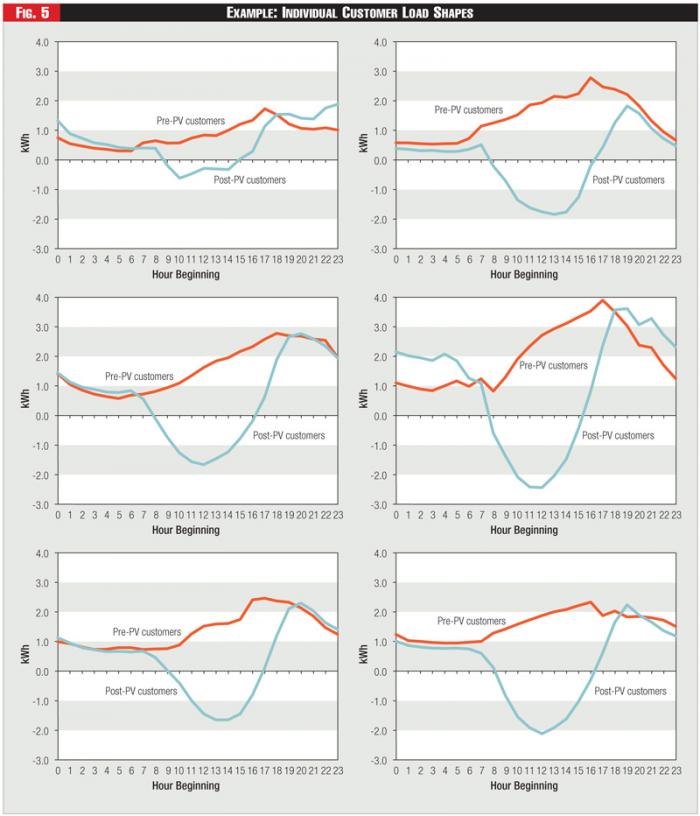 Figure 5 - Example: Individual Customer Load Shapes
The installation of PV systems reduces net energy consumption by half from 1060 kilowatt-hours to 530 kilowatt-hours.
However, it leaves average monthly peak demand virtually unchanged. In the summertime, PV systems reduce average residential customer monthly peak load from 6.8 kilowatts to 6.5 kilowatts.
Average net monthly peak export to the grid is 4.0 kilowatts in the summer and 5.4 kilowatts in the winter.
Figures Three and Four compare load shapes between the samples.
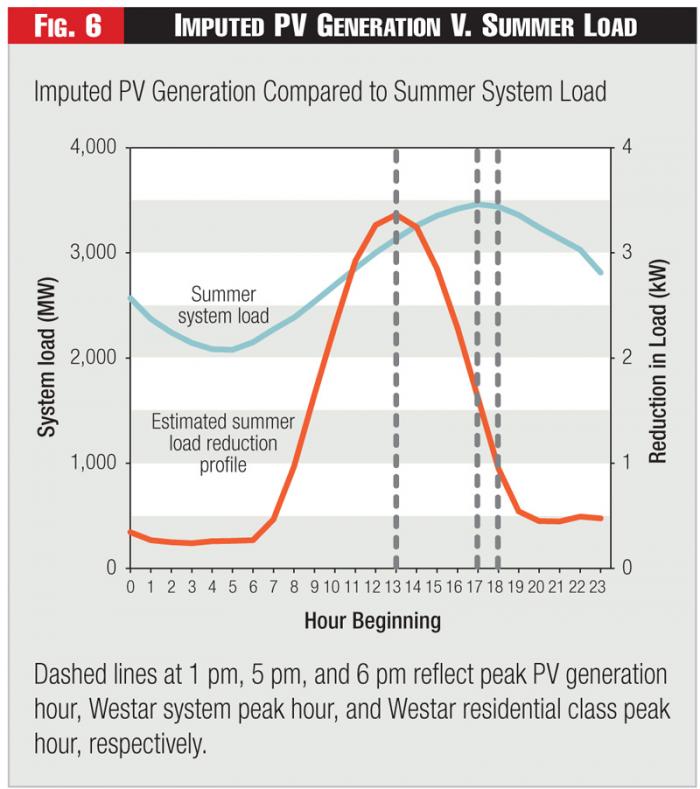 Figure 6 - Imputed PV Generation V. Summer Load
See Figures Three and Four.
There are clear differences in both seasons between the load shapes of PV and non-PV customers. PV customers generate excess power during the middle of the day such that their net load drops below the axis and becomes a negative number. The resulting load shape is sometimes referred to as the duck curve.
On a customer-by-customer basis, there is variation in size and shape, but the results are largely consistent with those shown above. Load shapes of six individual customers are shown in Figure Five.
See Figure Five.
System Load Shapes
There is no direct way to measure the generation of electricity by PV customers since they were served by a single meter and their generation occurs behind the meter. However, their power generation can be imputed by comparing their net load before and after the installation of the PV system, assuming the installation did not correspond with any other changes in gross load.
What we observe is that PV power generation peaks between 1 and 2 p.m. This does not coincide with the time that the Westar system peaks, which is between 5 and 6 p.m. At that time, PV power generation has dropped to forty-eight percent of its peak value.
Nor does it coincide with the time when the residential class peaks, which is between 6 and 7 p.m. At that time, power generation has dropped to twenty-eight percent of its peak value.
These results are shown in Figure Six.
See Figure Six.
Grid Dependency of PV Customers
Some have argued that customers with distributed generation are not as dependent on the grid as non-DG customers. However, we find that the installation of PV does not make customers independent from the grid.
After installation of DG, customers are still reliant on the grid for 99.2 percent of fifteen-minute intervals, when power is flowing either to the customer or from the customer back to the grid.
This number may be understated, because some customers had missing data for several days or even months. After removing customer-months without load data for the full month, we find that customers are relying on the grid 99.8 percent of the time.
Conclusions
We find that the installation of rooftop PV systems by residential customers yields a load profile that is remarkably different from that of the non-PV customers, justifying the creation of a separate rate class for PV customers.
On average, they have the “duck curve” shape whereas the non-PV customers have a humped-camel shape. Most individual customers within the DG sample followed the same patterns as observed in the average load shapes of DG customers.
After DG installation, customers reduced their monthly energy consumption by forty-nine percent in the summer, but only reduced their peak demand by 4.9 percent during the same months, resulting in a significantly lower load factor. Our results show that the load shapes of PV customers are significantly different from non-PV customers, and that most of the difference is directly caused by the installation of PV.
Our findings dispel some of the myths surrounding the impact of residential PV installations, as currently deployed, on system peak. They suggest that achieving peak reduction via residential PV systems will require more targeted deployments, if it is possible to realize any reduction in peak demand.
For mass market customers overall, though, our findings suggest that utilities and regulatory commissions should seriously consider creating a separate rate class and/or adding a demand charge dimension to rates.
