
Top States’ Secret Sauce
Dr. Sanem Sergici is a Principal in The Brattle Group’s Boston, MA office specializing in economic analysis of distributed energy resources (DERs); their impact on the distribution system operations and assessment of emerging utility business models and regulatory frameworks. She regularly assists her clients in matters related to innovative retail rate design, emerging technologies, big data analytics, grid modernization, and alternative ratemaking mechanisms.
Several states have forged ahead and are in the lead among the fifty in terms of successful energy efficiency programs. What explains the success of these leading states? And what are the lessons learned that are applicable to any state, leader or not?
PUF presents the perspectives and experiences of two thought-leaders, Sanem Sergici of The Brattle Group in the following article, and Tanuj Deora of Uplight. While Sergici looks broadly across the states, and takes us through her study's analysis, and while Deora focuses on a single state, both views are insightful breakdowns of what states can do to move into the lead in energy efficiency or to maintain their leadership heretofore secured. As you shall see for yourself by reading on.
Customer-sited energy efficiency is the nation's third-largest electricity resource, employing 2.3 million Americans and typically providing the lowest-cost way to meet customers' energy needs, according to the National Association of State Energy Officials 2019 U.S. Energy and Employment Report.
Undoubtedly, energy efficiency will be a vital component of the formula for success as more cities, states, and regions set increasingly ambitious clean energy goals and carbon reduction targets. As of May 2019, over a hundred and twenty cities and five states have committed to a hundred percent clean energy goals, according to the Sierra Club. Many utilities have also been making commitments to achieve significant greenhouse gas emissions reductions over the next couple of decades, and increased energy efficiency is a central part of many utilities' plans.
 Sanem Sergici: An exercise to explore the effectiveness of alternative EE administrator models would be incomplete if the presence or lack of incentives were not brought into the picture.
At the same time, the electricity sector is going through an important transformation due to increasing levels of distributed generation and electrification. A different approach to EE and more innovative programs will therefore be required, targeting deeper savings and broader participation for all customers.
There is also a need for a fresh look at the EE program administration and delivery steps; different models and incentives for entities undertaking these steps; and more broadly developing a coordinated approach for planning and integrating distributed energy resources, precisely because meeting ambitious clean energy goals will require improved coordination across the energy ecosystem. As of the writing of this article, some jurisdictions, such as New Jersey, Washington D.C., and California, are revisiting the role of the utilities in administering EE programs.
Prior to restructuring, the administration, design, and delivery of ratepayer-funded energy-efficiency program activities were largely the responsibility of utilities, operating within the context of an Integrated Resource Planning process that was overseen and governed by state regulators. Restructured states reconsidered prior models for energy efficiency administration and sought to find models better suited to the needs and requirements of new operating environments.
States ultimately implemented a variety of models under which state agencies, non-profit corporations, or independent third-party agencies administer EE programs. Each of these models are associated with their own unique strengths and weaknesses, which are presented in Figures 1 and 2.
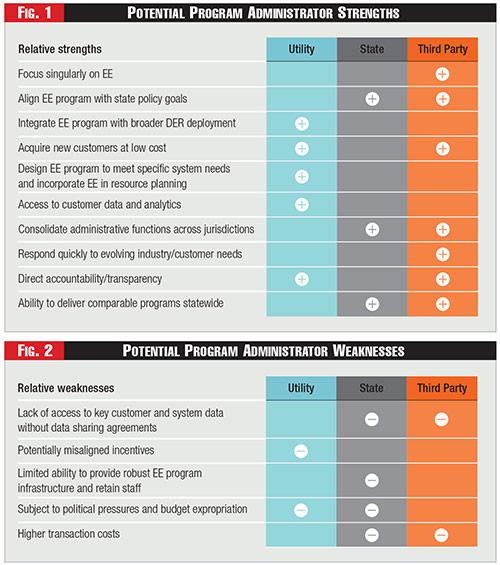 Figures 1 & 2 - Potential Program Administrator Strengths and Weaknesses
See Figures 1 and 2.
As can be seen from the qualitative comparisons in Figures 1 and 2, no single administrator model is necessarily superior to the others in all aspects of the EE deployment. Moreover, idiosyncrasies of administrators among states likely have a great deal of impact beyond the administrator model under which they operate.
Therefore, we move beyond these qualitative comparisons in our analysis and undertake a quantitative regression analysis to gauge the effectiveness of alternative EE administrator models in delivering successful EE outcomes. A key aspect of our methodology is to incorporate the effect of other important drivers of EE success such as a long term and credible commitment to EE program pursuit by states, which manifest in ambitious savings goals, dedicated funds for EE programs, and providing proper incentive mechanisms for the agents administering and/or delivering the EE programs.
Long Term EE Targets, Incentive Mechanisms
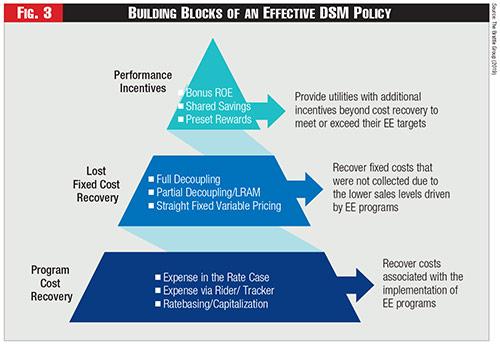 Figure 3 - Building Blocks of an Effective DSM Policy
Due to energy efficiency's increasingly important role in long-range utility plans and clean energy plans, many states have set long term energy efficiency targets or energy efficiency resource standards (EERS), and some states have instructed utilities to pursue all cost-effective energy efficiency. Moreover, the importance of energy efficiency is expected to increase further, as many states are encouraging utilities to rely more heavily on distributed energy resources and non-wires alternatives.
All of these efforts intend to moderate rate increases in the long term by focusing on lower cost solutions, lead to more environmentally responsible outcomes, and provide customers with more choice. Nevertheless, these targets and aspirations are harder to achieve without properly constructed incentive mechanisms. Utilities are important players in the EE ecosystem, with direct communication channels with customers and the best understanding of system needs.
Their true buy-in for the EE programs is essential even when the utility is not itself the EE program administrator.
Therefore, an exercise to explore the effectiveness of alternative EE administrator models would be incomplete if the presence or lack of incentives were not brought into the picture. For that reason, we review various regulatory incentive mechanisms available to utilities across the U.S. to address program cost recovery, lost fixed cost recovery, and performance incentives, and incorporate these mechanisms into our quantitative analysis. Figure 3 presents the building blocks of an effective demand side management policy.
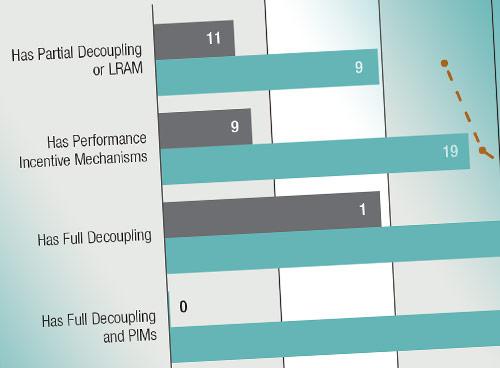
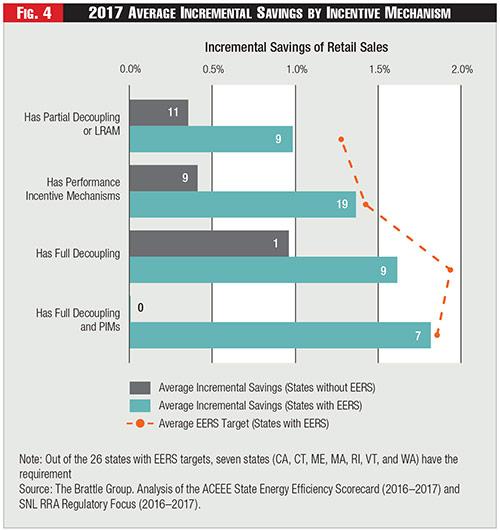 Figure 4 - 2017 Average Incremental Savings by Incentive Mechanism
See Figure 3.
Figure 4 compares the 2017 average incremental EE savings across states grouped by various incentive mechanisms. For each incentive mechanism, the gray bar represents the average savings for states that do not have an EERS; the teal bar represents the average savings for states that have an EERS, and the red dots represents the average EERS target (annual percent savings goal) in those states that have an EERS. Based on this figure, the best savings performance is achieved by states that have both full decoupling and PIMs, and that the presence of PIMs seems to have moved achieved savings closer to the EERS targets.
See Figure 4.
Quantitative Assessment of Different Models
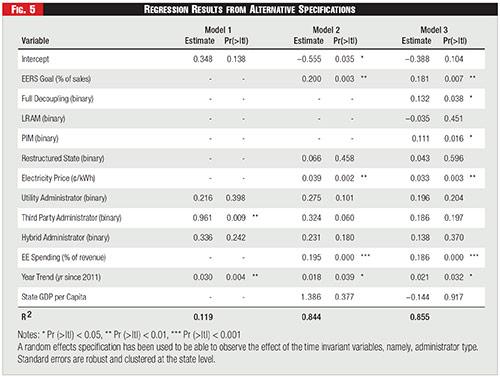 Figure 5 - Regression Results from Alternative Specifications
When exploring a complex phenomenon such as the effectiveness of EE administrator models on the EE program performance, data summaries and tabulations fall short in providing a complete picture. It is not possible to present all other drivers simultaneously that are also affecting the EE performance. Therefore, we have performed a regression analysis to properly account for all drivers of EE that are associated with the success of EE programs implemented over 2012 through 2017 for the fifty states and the District of Columbia, including the impact of different EE administrator models on program success.
We measure EE performance by using "annual EE savings as a percentage of total load served" as our dependent variable. For independent variables, we include categorical variables for administrator models and regulatory incentive mechanisms, and continuous variables to capture individual states' commitment to EE, such as the EERS goal and EE spending as percent of the total revenues. We also include variables to control for the impacts on the dependent variable from state economic activity, electricity price, restructuring status, and a time trend. Figure 5 presents the results from our regression model.
See Figure 5.
Model 1: Represents the naïve view of the world and explains the variation in the EE savings only by the variation in the administrator model. Results from this model indicates that on average third-party administrators are associated with the highest savings compared to the other models. This impact is statistically significant at the one percent level. While the other two administrator models, utility and hybrid, are associated with higher savings compared to the state administrator model, these impacts are not statistically significant at the five percent level.
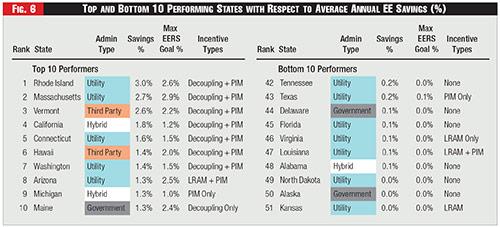 Figure 6 - Top and Bottom 10 Performing States with Respect to Average Annual EE Savings (%)
Model 2: Starts with the naïve model and includes several key variables that might help explain the variation in the EE success such as EERS Goal, Restructuring Status, Average Electricity Price, Annual EE Spending, and State GDP Per Capita. In this model, the third-party model is associated with higher savings compared to the state model but is now significant at the six percent level. Hybrid and utility models continue to have higher savings compared to the state model but are insignificant. EERS goal, electricity price, and EE spending variables are all positive and statically significant at the one percent level.
Model 3: Starts with Model 2 and adds incentive variables: full decoupling, LRAM, and PIMs. Results from this model indicates that after the inclusion of the incentive mechanism variables, none of the administrator models are now statistically significant, meaning that they no longer explain the variation in the annual EE savings. However, increased EERS target and increased EE budget are each associated with 0.18 percentage point (pp) increase in the annual EE savings.
Having full decoupling is associated with 0.13 pp increase while having a PIM is associated with 0.11 pp increase in annual EE savings, compared to states without such mechanisms. These variables are all statistically significant at the five percent level or higher.
The LRAM variable impact is negative but insignificant, meaning that LRAM does not seem to have an impact on annual EE savings. Electricity price and trend variables continue to be positive and statistically significant at the one percent level. This implies that the model is robust to the inclusion of new variables.
These results collectively indicate that none of the EE administrator models explain stronger EE performance, while other variables such as having an EERS goal, and having regulatory incentive mechanisms such as full decoupling and performance incentive metrics are all associated with stronger EE savings performance.
Having an EERS goal and dedicated funds for EE, which collectively represent a long-term and credible commitment to energy efficiency, has the largest impact on the stronger EE performance; followed by having a full decoupling mechanism and performance incentives.
In addition to the regression results, we looked at the characteristics of top ten and bottom ten performer states ranked by their average annual savings in the 2015-2017 timeframe.
Of the top ten performers, eight of them have decoupling and nine of them have a performance incentive mechanism. Interestingly, none of the bottom ten performers has a decoupling mechanism in place and only two have a performance incentive mechanism.
This tabulation confirms the results we have seen in the regression analysis. It is important to note that utility administrators make up the majority in both the top ten and bottom ten list, however it is difficult to derive any conclusions from this observation as utility administrators represent the majority of all administrators in the U.S. (Thirty-five out of fifty-one.)
Where Do These Results Leave Us?
We are at a time where utilities and the market forces governing their business decisions are evolving expeditiously. It is quite plausible that the new energy era will require a model in which different entities jointly design, administer, and deliver energy efficiency programs and each leads the area where their comparative advantage lies.
For instance, there could be opportunities/roles for third-party EE companies to share some of the program delivery functions with the utilities or third-party administrators through an RFP process and meeting well-defined needs. They may also gain business through direct relationships with customers, earn payments for aggregation services from wholesale electricity markets, or procure business from utilities through competitive solicitation process. For example, in Texas, utilities administer EE programs through project sponsors that customers themselves elect.
Utilities may engage in the platform provider role and integrate services from other providers, as well as offer a broad range of EE services through a services and solutions marketplace. Some of these innovations are currently happening in several jurisdictions such as California, Illinois, Texas, and New York but are still fairly limited in their scale and scope.
While these changes are happening, it is important to understand and learn from the experience with energy efficiency in the last decade and incorporate those learning in the new planning, administration, and regulatory processes for EE. In this article, we uncover and summarize some of these learnings based on our research and analysis:
First, all administrator models have certain strengths and weaknesses. Each jurisdiction should weigh these strengths and weaknesses and decide which model is likely to yield the most cost-effective and sustainable framework for administering and delivering EE programs. The selected model should enable pursuit of more innovative programs targeting deeper savings.
Second, administration and delivery of energy efficiency programs is a complex, multi-step process.
Given that the energy efficiency sector is a large ecosystem made up of a multitude of players including regulators, utilities, and third-party providers, one of the most important roles of an administrator is to leverage comparative advantages of all involved entities and to integrate them seamlessly.
Third, utilities' full support and pursuit of EE initiatives play a key role in the success of EE programs (even when the utility is not itself the EE program administrator). More specifically, utility incentives should be aligned with the goals of the EE programs by providing them with certain and timely program cost recovery, eliminating risk of lost revenue (decoupling), and providing opportunities to improve their earnings based on how well they meet certain targets.
Fourth, our empirical results suggest that no single administrator model is associated with better EE performance, as measured by annual EE savings. What matters most is having a state level energy efficiency goal, dedicated EE funding, the availability of full decoupling, and performance incentive mechanisms. These four drivers collectively highlight the importance of a state's commitment to a long-term energy efficiency agenda and enabling utilities with the right incentives to help and be partners in achieving that agenda. While several studies highlighted the importance of these four drivers, we have empirically demonstrated that they are indeed the ones that matter the most.
Last but not least, utilities are well positioned to integrate EE programs with broader DERs (including demand response, behind the meter generation, storage, and IoT device management) and to reduce overall cost to serve customers. This is because they are typically responsible for system planning functions such as undertaking integrated resource plans (IRPs) or distribution system plans. However, these economically efficient outcomes will emerge only if demand side resources are put on equal footing with conventional generation resources on the supply side and capital investments on the distribution grid. If utility demand side investments are not associated with similar earning opportunities, utilities will naturally prioritize capital intensive grid projects over demand side investments, potentially at the expense of achieving a lower cost resource mix.
This article is based on a report written for Uplight Inc. in 2019.
See also Top Performing States in Energy Efficiency, a Q&A with Tanuj Deora of Uplight at the recent NARUC Winter Policy Summit.
