
Database Utilities Fortnightly
Steve Mitnick is President of Lines Up, Inc., Editor-in-Chief of Public Utilities Fortnightly, author of “Lines Down: How We Pay, Use, Value Grid Electricity Amid the Storm.”
We did this for thirty-seven different control areas and utility service territories. What is it that we did?
For each one of them, the Public Utilities Fortnightly team plotted their load duration curves during the four fortnights, that is, the eight weeks, from the first of April — when social distancing generally became the practice nationally — through the twenty-sixth of May. So, each of these load duration curves was based on thirteen hundred and forty-four hourly megawatt-hour values of customer demand for electricity.
And then, we compared these load duration curves to their curves during the same four fortnight period last year, in 2019 (the first of April through the twenty-sixth of May of last year). Comparing the 2020 load duration curves to the 2019 load duration curves allowed us to check out the changes brought on by the coronavirus crisis and its consequences for customer demand.
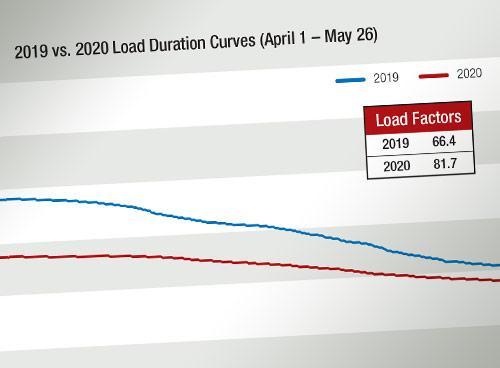
The results were truly remarkable. In the most affected parts of the country, the load duration curves have significantly flattened, reflecting the present situation in which so many people are staying at home rather than spending weekdays nine-to-five at work places.
Download the article in PDF format containing the load duration curves for the first of April through May twenty-sixth of 2019 and 2020 for eight selected utility service territories. These are among the service territories in which the load duration curve has been most impacted by the coronavirus crisis.
The load duration curves of Baltimore Gas and Electric, Con Edison's New York City area, Dominion Virginia Power, Duke Energy's Progress East area, PECO Energy, Pennsylvania Power and Light, Public Service Electric and Gas, and Santee Cooper have significantly flattened this year from last year. This flattening can be captured in the commonly-used statistic in electricity end-use analysis called the load factor.
The load factor is simply the average of all the hourly megawatt-hour values of customer demand during the period studied, divided by the highest (or peak) value of customer demand during the period. Thus, a load duration curve with a low load factor suggests customer demand is relatively variable and peaked. Conversely, a load duration curve with a high load factor suggests customer demand is relatively consistent and not particularly peaked. Such a pattern of customer demand is typically more economical for a utility to serve.
For example, the load factor of Baltimore Gas and Electric went from 60 percent during the four fortnight period in 2019 to 71.4 percent during the same period in 2020. Similarly, the load factor of Dominion Virginia Power went from 62.4 percent during the four fortnight period in 2019 to 74.1 percent during the same period in 2020.
At these two and the other six selected utility service territories, as implied by the increased load factors, the load duration curves for the period this year are clearly flatter than last year. In these parts of the country and in many of the most-affected areas by the coronavirus crisis, the change in commercial and industrial customer demand is quite prominently represented by the load duration curve and the load factor statistic.
