
Graphics
Steve Mitnick is President of Lines Up, Inc., Executive Editor of Public Utilities Fortnightly, and author of a new book, “Women Leading Utilities, the Pioneers and Path to Today and Tomorrow.”
The gold standard on residential electric bill data, the federal government's Consumer Expenditure Survey, has just been updated by the U.S. Bureau of Labor Statistics, on the twenty-ninth of April, for the twelve-month period through June 2020. The extraordinary credibility and comprehensiveness of the CES comes from the huge sample size of approximately twenty thousand American households, the extreme detail and care of the surveyors (including in-person visits and expense diaries), and its long track record since the early nineteen-eighties. While the last three months of this twelve-month period through last June were affected by the pandemic, the impact on this latest data seems to be minimal.
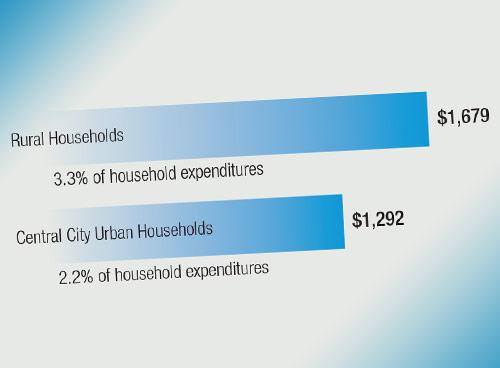
Here the PUF team illustrates big takeaways on the comparison of the electric bills of high income households versus low income households, older households versus younger households, rural households versus urban households, and households in the south of the country versus those in the west. Figure 1 shows that even though high income households tend to have considerably higher electric bills, electricity's share of their household expenditures is considerably lower than that for low income households. Figure 2 shows that electric bills tend to be a bigger burden on older households but not by that much. Figure 3 shows that rural households tend to pay much more for their electric service than do central city households in both absolute terms and as a percentage of their total expenditures. And Figure 4 shows that households in the south census region tend to pay significantly more for electricity than do households in the west census region, where the summer climate that drives air conditioning usage is milder.

