
EPRI’s Household Energy Costs Analysis Shows Potential Electrification Benefits
Geoffrey Blanford is EPRI Principal Technical Executive for Energy Systems and Climate Analysis.
Household energy spending is a key metric for understanding energy affordability. EPRI’s recent Energy Wallet report looks at average energy expenditures per household, highlights key differences across states, and projects potential future trends.

Even with higher energy prices, electrification and efficiency stand to reduce total household energy costs over the next twenty-five years. Why? Spending more on electricity means spending a lot less on other fuels.
What Is the Energy Wallet?
The Energy Wallet measures households’ total direct purchases of energy, including fuels used in the home and for personal vehicles. Unlike metrics that focus solely on electricity or utility bills, the Energy Wallet gives a fuller picture of how much families spend energizing their homes and vehicles, including:
Utility bills for electricity and natural gas; Heating fuels like propane and fuel oil; Gasoline for personal vehicles; Public electric vehicle charging; and Amortized costs of residential solar systems.
The report found the U.S. average Energy Wallet was five thousand five hundred thirty dollars per household, with gasoline comprising the largest share at two thousand nine hundred thirty dollars, followed by electricity at one thousand eight hundred fifty dollars. Natural gas and other heating fuels made up four hundred eight-five dollars and one hundred ninety-two dollars, respectively. These calculations are based mainly on EIA data.
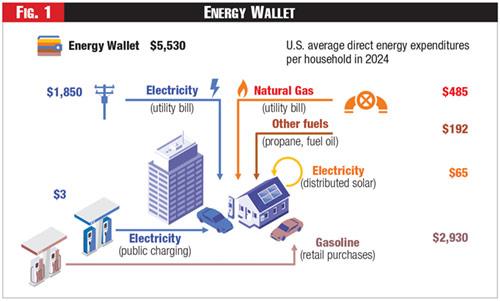 Figure 1 - Energy Wallet
See Figure 1.
Regional Differences in Energy Spending
Average per household spending varies widely across states, due to factors like climate, fuel mix, energy prices, and consumption patterns. For example, New England and Alaska had the highest average energy costs in 2024, driven by cold climates and reliance on what were more expensive heating fuels, such as propane and fuel oil.

Utah had the lowest costs, thanks to its mild climate and relatively low energy prices. In California and Hawaii, high energy prices were offset by mild climate and energy efficiency, resulting in lower per household electricity use, but roughly average per household energy expenditures.
Meanwhile, in states with low energy prices but high cooling demands and widespread use of electric heating — such as Louisiana — electricity usage per household was high but overall expenditures were in line with the U.S. average.
Even with the variation across the country, average per household electricity spending in all states represented less than half of the total Energy Wallet.
Historical Trends
Despite fluctuations in fuel prices and demand, the average Energy Wallet has remained relatively stationary in real (inflation-adjusted) terms since 2000. While total nominal household energy costs have more than doubled, real per-household spending in 2024 was at about the same level as in 2000.
Most of the volatility in household energy spending came from gasoline prices, which ranged from two dollars fifteen cents to four dollars seventy-five cents per gallon (U.S. average in 2024 dollars) over the past two decades.
Electricity prices have risen recently in the U.S. — up thirty percent in nominal terms since 2020 — but only by five percent when adjusted for economy-wide inflation. Most of this increase occurred in a few states, especially California, where distribution costs absorbed significant wildfire impacts and prevention efforts, as well as New England and other states experiencing higher transmission and distribution costs.
At the same time, efficiency improvements, and in some states behind-the-meter solar, led to a slight decline in grid-based electricity use per household, resulting in relatively flat total electricity expenditures per household.
Looking Ahead: Electrification Drives Savings
EPRI modeling suggests that potential future trends in electrification and efficiency could have a big impact on the Energy Wallet. Using its US-REGEN energy systems model to simulate future energy technology adoption and expenditures under different scenarios, the analysis showed that electrification of personal vehicles and other building services could lead to significant savings.
Across lower and higher price scenarios, which vary assumptions about the phase-out of IRA clean energy subsidies and market prices for oil and gas, U.S. average energy expenditures per household decline by thirty-six percent to forty-two percent by 2050.
Even with higher prices for electricity and other fuels, and despite increased consumption and overall spending on electricity in particular, total spending on energy per household is projected to be lower. All states see reductions by 2050, ranging from ten percent to fifty percent in the higher price scenario and from seventeen percent to fifty-five percent in the lower price scenario.
In both scenarios, electric vehicles are projected to comprise around ninety percent of the light-duty fleet by 2050. They use about one-third of the energy per mile compared to internal combustion engine vehicles, which translates into lower energy spending for personal transportation. Combined with lower maintenance costs, even with higher upfront costs, the favorable economics for electric vehicles are an important driver of increased adoption.
Electrification and efficiency improvements of other building end-uses also contribute to savings. Heat pumps for space and water heating and more efficient appliances and lighting can all reduce energy consumption even as service demands grow.
Next Steps for Affordability

EPRI’s Energy Wallet provides a useful framework to help utilities, consumers, and policymakers understand household energy affordability in a changing landscape. By covering the full spectrum of energy costs, it enables more informed decisions about technology investments, policy design, and consumer behavior. This broader view is essential to capture the potential impact of fuel-switching, especially the electrification of personal vehicles.
Future EPRI research will further explore electrification trade-offs at the household level, including non-energy costs, as well as how energy expenditures vary across different household types (moving beyond state-level averages). Ultimately, measuring affordability means accounting for energy costs, income, and other financial constraints for all households. The Energy Wallet report is a first step in that direction.
To view the full report and interactive state-level map, visit energywallet.epri.com.
