

Ounce of Prevention
Sam Kozel is Halcyon Head of Intelligence Services. Donald McPhail is eSmart Systems Vice President of Market Development.
Electric utilities and their regulators have long been effective with planning institutions: integrated resource, distribution, and transmission planning provide the architecture for balancing supply and demand, justifying investments, and maintaining reliable service. Over the past decade, two frameworks have joined that lexicon: wildfire mitigation and resilience planning.
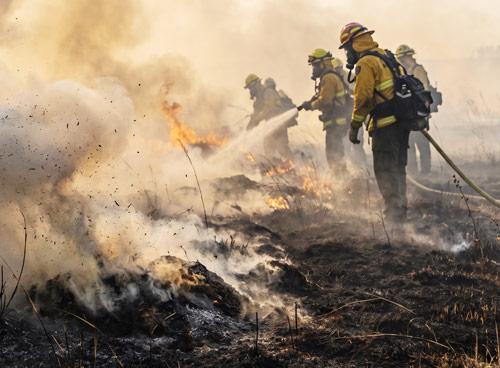
When California enacted SB 901 in 2018, requiring its investor-owned utilities to file comprehensive Wildfire Mitigation Plans (WMPs), the policy read as a California response to a California crisis.
The Camp Fire later that year, which destroyed the town of Paradise and killed 85 people, brought that urgency into utility front offices and legislatures nationwide. Wildfire was no longer an episodic reliability event but an existential threat to utility operations, customer safety, and the traditional utility business model.
Since then, Oregon, Utah, Nevada, Colorado, Hawaii, Idaho, Montana, Texas, Washington, and Wyoming have enacted similar requirements, and Arizona, Kansas, New Mexico, and Missouri are investigating them.
A Pacific Northwest National Laboratory database tracks nearly 500 WMP filings, 178 unique filers across 20 states, with the Pacific Coast and Mountain West accounting for nearly all activity. The WMP has become a standard regulatory tool in wildfire-exposed regions, but the practice is still evolving.
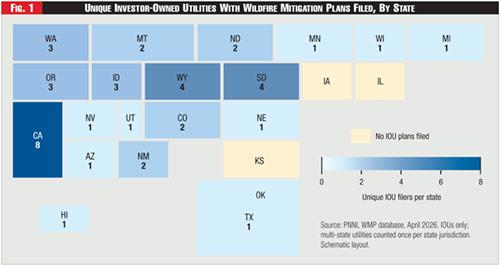 Figure 1 - Unique Investor-Owned Utilities With Wildfire Mitigation Plans Filed, By State
States are not copying California so much as adapting wildfire planning to their own risk profiles and cost pressures. Wildfire risk is rising, and costs are rising with it. As the suite of prevention-focused tools and technologies matures, we are gaining a clearer sense of which types of investments buy down the most risk per dollar spent.
A clarity that makes it more possible to hold WMPs to a higher and more comparable standard. The opportunity now is to make WMPs more understandable, comparable, and evaluator-friendly, much as integrated resource and transmission plans became over time.
See Figure One.
The Scale of the Commitment
The U.S. Congress Joint Economic Committee estimates wildfires cost the country between $394 billion and $893 billion a year, including up to $202 billion in electricity losses. The commitments embedded in approved WMPs are now substantial rate drivers: an analysis of recently approved plans for nine utilities across seven states reveals more than $29 billion in planned mitigation investment over their three-year cycles.
 Sam Kozel: The SEPA May 2026 white paper, ‘Wildfire Technology Landscape: A Framework for U.S. Utilities,’ developed with utility and regulatory advisors and providers including eSmart Systems, Pano AI, and Technosylva, maps these tools across a six-stage risk-reduction framework.
California’s three IOUs account for the bulk. PG&E’s 2026-2028 Base WMP, approved by the state’s Office of Energy Infrastructure Safety (OEIS) in February 2026, carries an $18.6 billion budget; Southern California Edison’s approved plan totals $6.3 billion and SDG&E’s $1.04 billion.
Outside California the scale is smaller but growing: Colorado’s Public Service Company (Xcel) won a $1.9 billion 2025-2027 plan, and Hawaiian Electric’s $535 million plan followed the Lahaina disaster, with NorthWestern Energy, Portland General Electric, Rocky Mountain Power, and Idaho Power extending the obligation across much of the West.
But raw dollars obscure differences in ratepayer burden. Per customer, PG&E spends over $1,000 a year, more than twice SCE ($400) and nearly four times SDG&E ($227); per circuit mile, PG&E and SCE run nearly identical 125,000-mile networks, yet PG&E spends almost five times as much, reflecting its greater high-fire-threat exposure, being an earlier mover, unique legal environment, post-bankruptcy obligations, and the rigorous regulatory review process that accompanies wildfire mitigation planning in California.
See Figures Two and Three.
Why California Spends More
 Donald McPhail: The next phase cannot simply be more spending, more hardening, and longer lists of projects as the affordability implications of this approach are only just beginning to reach customer bills.
At the center of that history is a legal standard unique to California: inverse condemnation. Under this strict-liability doctrine, an investor-owned utility is responsible for property damage from fires ignited by its infrastructure regardless of negligence; a spark in high winds can expose it to billions in damages without any finding of fault, even if the line was inspected, hardened, and operating within standards.
No other western state applies that standard. Arizona, Idaho, Montana, Utah, and Wyoming grant utilities that act reasonably and implement an approved WMP a presumption against liability or an affirmative defense; Kansas capped punitive damages at $5 million per claim in 2025; and Texas’s WMP statute, adopted in November 2025, extends a liability safe harbor to utilities that follow their approved plans.

California’s doctrine leaves its utilities with an asymmetric calculus — underinvestment carries catastrophic liability while overinvestment is recoverable through rates — that drives spending and makes cross-state comparison difficult.
That risk is rippling outward through insurance: Puget Sound Energy’s cumulative liability premiums rose 329 percent from 2019 to 2024, and Wisconsin’s PSC approved deferred accounting for $9.6 million in excess insurance costs at Xcel, on a system with no wildfire claims, highlighting how insurers are increasingly incorporating wildfire risk into pricing and coverage decisions across the industry.
What Regulators Now Require
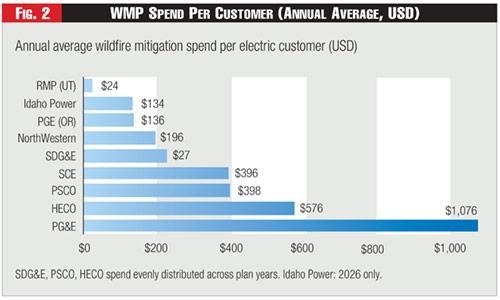 Figure 2 - WMP Spend Per Customer (Annual Average, USD)
Early WMPs read as narrative-backed plans built in real time. As the practice matures, regulators want plans that tie spending to specific risks, measurable outcomes, and clear timelines.
Several shifts stand out. Planning horizons have lengthened: California moved from annual filings to three-year base plans with annual updates, a model now adopted in Oregon, Colorado, Idaho, Utah, and Hawaii, while Texas requires reapproval every three years plus “material change” filings.
Prioritization is now risk-informed, with regulators increasingly requiring utilities to show the Risk Spend Efficiency (RSE) of proposed mitigations, and California’s SB 254 (2025) requires an estimated cost-per-avoided-ignition for each risk category.
Independent evaluation is spreading: Texas mandates a third-party evaluator, and Montana’s review of NorthWestern’s first plan illustrates how regulatory expectations continue to evolve, with commissions increasingly seeking more detailed, standardized, and regulator-focused submissions. Oregon has gone furthest on standardized, comparable data across utilities regarding asset management, inspection and risk reduction.
What’s Working
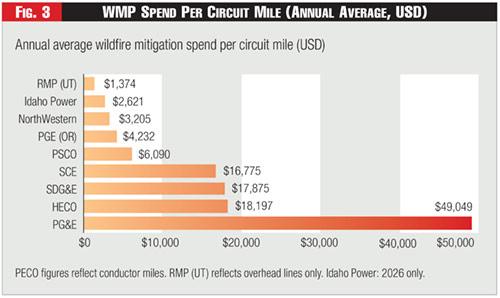 Figure 3 - WMP Spend Per Circuit Mile (Annual Average, USD)
The question now is whether that capital is being deployed efficiently. Because wildfire risk is, in the worst case, unbounded — from loss of life to destroyed communities to utility bankruptcy — there is a structural bias toward capital-intensive solutions, but several mechanisms are emerging to improve cost-effectiveness.
The clearest is technology. Across nearly every recent WMP, utilities are deploying drones, LiDAR, aerial imagery, and AI-enabled analytics to sharpen infrastructure inspection. The Smart Electric Power Alliance (SEPA) May 2026 white paper, “Wildfire Technology Landscape: A Framework for U.S. Utilities,” developed with utility and regulatory advisors and providers including eSmart Systems, Pano AI, and Technosylva, maps these tools across a six-stage risk-reduction framework.
eSmart Systems, for example, analyzes drone, aerial, and ground imagery to assign each asset a zero-to-one ignition index based on component-level condition, replacing age-based proxy assumptions and surfacing gaps in utility asset records.
In Colorado, Xcel is using drone imagery both to detect defects and to build a pole-level inventory it lacks today. Detection and modeling are advancing in parallel. Pano AI operates 360-degree camera stations that flag smoke with AI, confirm it with a human analyst, and alert the utility and response agencies within minutes, putting every institution in the same operational picture.
Technosylva supports agencies and utilities with comprehensive multi-hazard risk intelligence, continuously simulating and forecasting hourly fire risk and danger to inform operational action and drive demonstrated, long term risk reduction.
Rhizome quantifies wildfire risk so utilities can make proportional-level investment decisions across projects by risk adjusted return rather than by category, the kind of avoided risk and tail risk data that RSE and cost per avoided ignition calculations depend on.
On the operational side, fast-trip settings and public safety power shutoffs have become near-universal and far more surgical when used with precise, predictive modeling. As an example, SCE’s Rapid Earth Fault Current Limiter program has produced zero ignitions on circuits where installed.
The Capital Bias
These tools mark real progress, but they coexist with an investment dynamic that still favors capital-intensive consequence management over root-cause prevention. Nowhere is that clearer than undergrounding.
Placing distribution lines below ground eliminates overhead ignition risk, and California has legislated a ten-year undergrounding program for its IOUs, but underground construction typically costs several times equivalent to overhead work, and regulators have increasingly focused on documenting cost effectiveness and demonstrating measurable risk reduction as undergrounding programs continue to expand.
Recent regulatory proceedings involving SDG&E underscore the importance of documenting expenditures and clearly demonstrating the relationship between investments and risk reduction, while Rocky Mountain Power’s experience illustrates how wildfire mitigation programs continue to evolve over time as project scopes, implementation timelines, and regulatory expectations are refined.
The deeper issue is what undergrounding optimizes for. Hardening and undergrounding answer one question — “How do we reduce damage when ignition occurs?” — while a prevention-first framework answers a different one: “How do we keep a fault from becoming an ignition at all?”
Integrated sensor networks, AI fault detection, inspection analytics, and real-time fire-weather modeling — the capabilities profiled in the SEPA framework — point toward the second question, promising better outcomes at lower cost per unit of risk reduced.
Utilities are, in practice, pursuing a portfolio of complementary approaches rather than choosing one over the other, and regulators increasingly encourage investments that demonstrate measurable risk reduction and cost effectiveness. Whether regulators will use these frameworks aggressively enough to redirect capital remains uncertain: rate base still grows with capital additions, while many of the most cost-effective prevention measures are expensed rather than capitalized.
The Unsolved Problems
Several questions remain open. Utilities often lack precise knowledge of their most vulnerable circuits, because asset-condition data sits siloed across inspection programs rather than feeding ignition-probability models, a challenge Idaho Power and other utilities have identified as they work to better integrate inspection, asset management, and risk-modeling data.
Cost-benefit frameworks struggle with wildfire’s unbounded downside, systematically undervaluing prevention when a fault can mean loss of life. And affordability pressure is intensifying. California’s Public Advocates Office recommended roughly $348 million less than PG&E requested in distribution O&M in its 2027 rate case.
Conclusion
Nearly eight years after California first required comprehensive wildfire mitigation plans, the WMP has proven both necessary and in need of evolution. It has created a durable framework for investments utilities can no longer defer and forced them to make wildfire risk visible. But the era of unconstrained wildfire spending is ending.
The next phase cannot simply be more spending, more hardening, and longer lists of projects as the affordability implications of this approach are only just beginning to reach customer bills.
The good news is that utilities and regulators now have better tools than ever: better risk models, clearer asset-condition data, stronger inspection analytics, and a fuller accounting of prevention technologies that reduce risk before a fault becomes an ignition. The opportunity now is to use those tools to strengthen wildfire mitigation planning and bring discipline to the billions of dollars flowing through these programs to ensure investments deliver the greatest possible reduction in wildfire risk.
